Tuesday, January 19, 2016

Johnson & Johnson (NYSE: JNJ)

Johnson & Johnson, together with its subsidiaries, researches and develops, manufactures, and sells various products in the healthcare field worldwide. It operates in three segments: Consumer, Pharmaceutical, and Medical Devices. The company distributes its products to general public, retail outlets and distributors, wholesalers, hospitals, and health care professionals for prescription use in the professional fields by physicians, nurses, hospitals, and clinics.
Take a look at the 1-year chart of J&J (NYSE: JNJ) below with the added notations:
1-year chart of J&J (NYSE: JNJ)
Through all of its ups and downs, JNJ is sitting right about where it was at this time last year. During that time, the $96 price level has become very important to the stock. Not only has the $96 level been a repeated support (green), but that level was also a brief resistance area (red) back in the fall. Now that JNJ is back above it, $96 is acting as support once again.

The Tale of the Tape: JNJ has a key level at $96. A trader could enter a long position on a pullback to $96 with a stop placed under the level. However, if traders are bearish on the stock, a short trade could be made instead on a break of the $96 support.

S&P500, MSFT Microsoft, TM Toyota, TSLA Tesla charts

Since mid-2014, the US stock market has been showing signs of the underlying market weakening. During the last quarter of 2015, the stock market had its first major bout of distribution selling, which confirmed our analysis that the bull market is nearly over.

If you have been following my articles for a while, then you may be tired of my warnings of the bear market, which is on the verge of starting. In fact, the TSX Toronto stock exchange, US Transportation index and the Russell 2000 small-cap index have all been in bull blown bear markets for six months already.

I won’t say we are in a full-fledged bear market until we see the large cap indexes breakdown. Until the S&P500, Dow Jones, and NASDAQ fall below critical support the US stock market is still in an uptrend. 
Instead of talking about the all the manufactured strong earning numbers created by share buyback programs, sales being way down for most companies, shipping companies struggling for products to ship, and products and service prices being reduced to help generate sales (deflation), let me share with you some monthly charts that I think paint a simple and clear picture of what is happing in the US stock market.

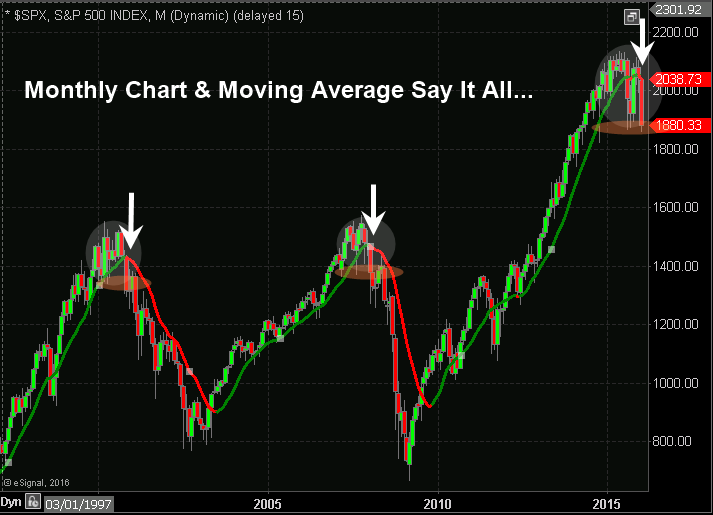
Monthly SP500 Index Trend Chart

The chart speaks for its self, but if you don’t know what you are looking at let me elaborate. Price action in 2015 shows increased volatility, heavy volume selling of shares, few stocks are trending higher each week and now this index is on the verge of breaking through critical support.
If the price falls any lower it will trigger an event that will take years to recover from. The event being a bear market that could make the 2001 and 2008 bear markets look not that bad.

What should an investor do?

You have three choices:
  • Do nothing and suffer the consequences
  • Move all your investment capital to cash and just sit on the sidelines for a year or two and let price drop so you can re-enter when prices are at bargain levels dividends are high.
  • Employ a strategy to profit from the falling market and possibly double your investment capital within a year or two with a few well-timed trades. This is what I do and share with subscribers of my newsletter.
spx monthly chart

Monthly Microsoft Chart:

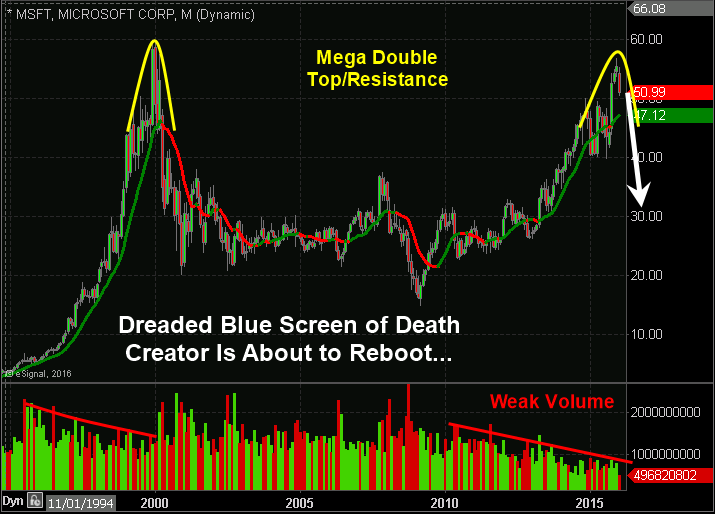
I find it interesting that Microsoft shares have been on fire to make near all-time highs during a time with Apple loses its product creator and fails to come out with anything new and exciting.
A couple months ago I talked about Apple setting up for a big drop when the price was at $122.xx. Today it's trading at $97 a 21% drop and it looks like we could see another 20% drop from here.
monthly microsoft chart

Monthly Toyota Chart:

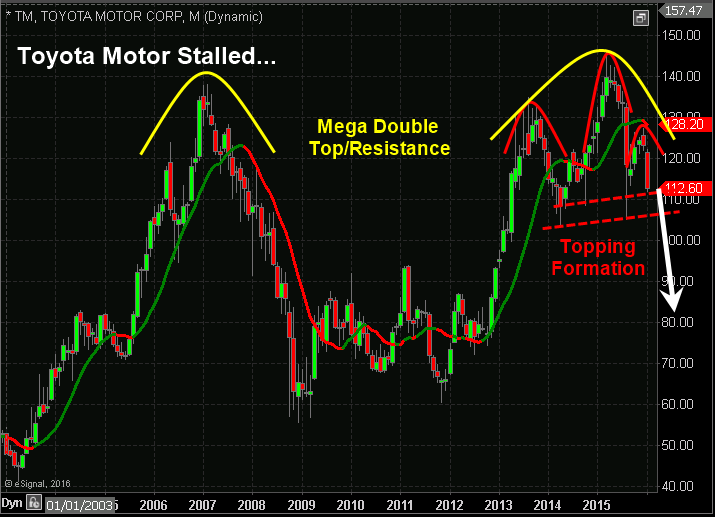
Toyota shares are just one of the hundreds of stocks setting up for a huge drop. I like this example as it’s a massive double top from 2007 high and has a bearish head & shoulders pattern testing its breakdown level.
toyota monthly chart

Monthly Tesla Chart:

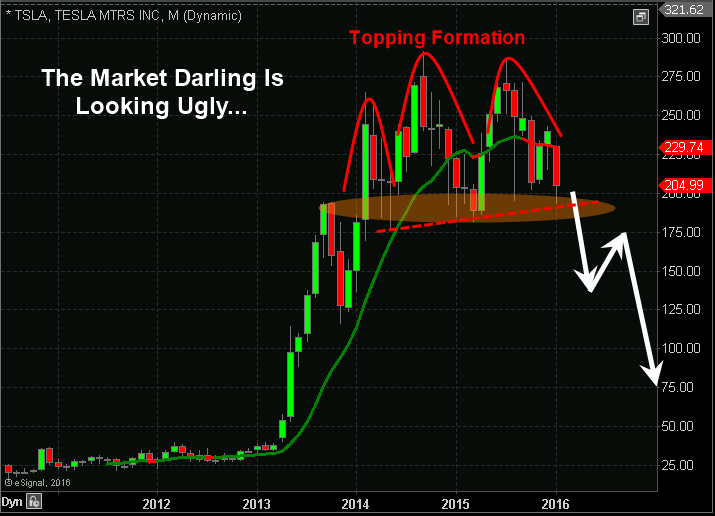
This was and still is the best stock in the world to many traders, investors and those unique Tesla owners. I say that because I know two men who have Tesla’s and it’s like they are in a cult with their electric cars and think ICE cars are old school (ICE – Internal Combustion Engine). Maybe I am a little jealous because I just bought and ICE car off a Tesla owner in my town and I had the privilege to take it for a drive – WOW it’s weird but AWESOME!
tesla monthly chart

Trading the Stock Market Conclusion:

In short, I fell 2016 is going to be nasty for those holding stocks in their portfolios. There are many ways to take advantage and profit from falling prices and that is exactly what myself and those who follow my forecasts and trades will do.

Monday, January 18, 2016

National Retail Properties, Inc. (NYSE: NNN)

National Retail Properties, Inc. is a publicly owned equity real estate investment trust. The firm acquires, owns, manages, and develops retail properties in the United States. It provides complete turn-key and built-to-suit development services including market analysis, site selection and acquisition, entitlements, permitting, and construction management. The firm also focuses on purchasing and financing net-leased retail properties.
Take a look at the 1-year chart of National (NYSE: NNN) below with my added notations:
1-year chart of National (NYSE: NNN)
Over the several months NNN has been trending consistently higher, while also forming a nice trend line of support (green). Always remember that any (2) points can start a trend line, but it’s the 3rd test and beyond that confirm its relevance. As you can see, the market deems NNN’s trendline to be important. A pullback to that line will provide trading opportunities, one way or another.

The Tale of the Tape: NNN has a trend line support to monitor. A long position could be entered on a pullback to the trendline, with a stop placed below the level of entry. A short position could be entered if NNN were to break below its trendline.

LINC: Lincoln Educational Services Breakout


US Weekly Economic Calendar

time (et) report period ACTUAL forecast previous
MONDAY, JAN. 18
None scheduled
Martin Luther King Jr. holiday
TUESDAY,  JAN. 19
10 am Home builders' index Jan.
62 61
WEDNESDAY, JAN. 20
8:30 am Consumer price index Dec. 0.0% 0.0%
8:30 am Core CPI Dec. 0.1% 0.2%
8:30 am Housing starts Dec. 1.218 mln 1.173 mln
THURSDAY, JAN. 21
8:30 am Weekly jobless claims Jan. 16
280,000 284,000
8:30 am Philly Fed Jan -6.0 -10.2
FRIDAY, JAN. 22
9;45 am Markit PMI flash Jan. -- 51.2
10 am Existing home sales Dec.
5.16 mln 4.76 mln
10 am Leading economic indicators Dec. -- 0.4%