Two weeks ago I started to get all excited about the US Dollar Index.
With the amount of pessimism in this market, the key reversal day on
May 8th came at the perfect place and perfect time. But simultaneously,
the
$EURUSD confirmed a failed breakout and key reversal day to the downside. I believe the selling in this market continues.
Here is a weekly chart of
$EURUSD going back to the 2008 all-time highs. I first brought up this chart two months ago, but the currency continues to struggle at this level. Look at the failed breakout and quick reversal:
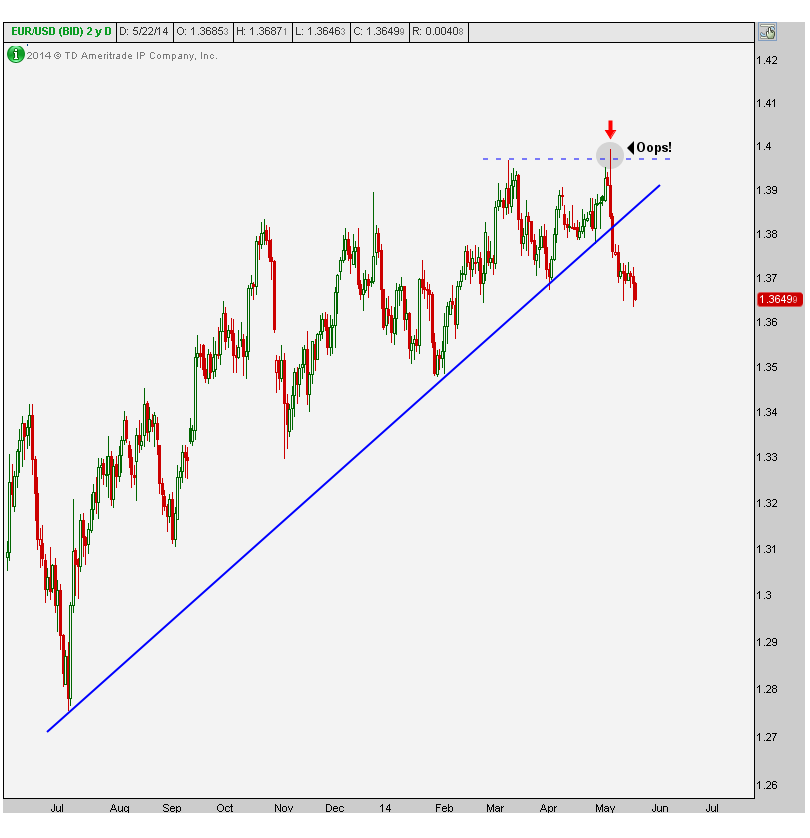
Now take a look at a shorter-term chart. Look at that key reversal
day on May 8th. Prices hit the highest levels since 2011 on an intraday
basis, and then reversed course to go out at the lows. The selling
continued after that confirming the failed breakout:
The problem I see with EURO is that we have failed breakdowns on
multiple time frames and at multiple resistance levels. On the weekly
chart, we have a multi-year downtrend line that it failed to take out.
On the daily chart, we have horizontal resistance that it failed break.
This is not good. I would expect further downside in this market.
To me that’s great for US Dollars as the Euro represents 60% of the
US Dollar Index. A sell-off here would give the greenback a major boost.
Please share this article


 Click Here to Listen to the Audio
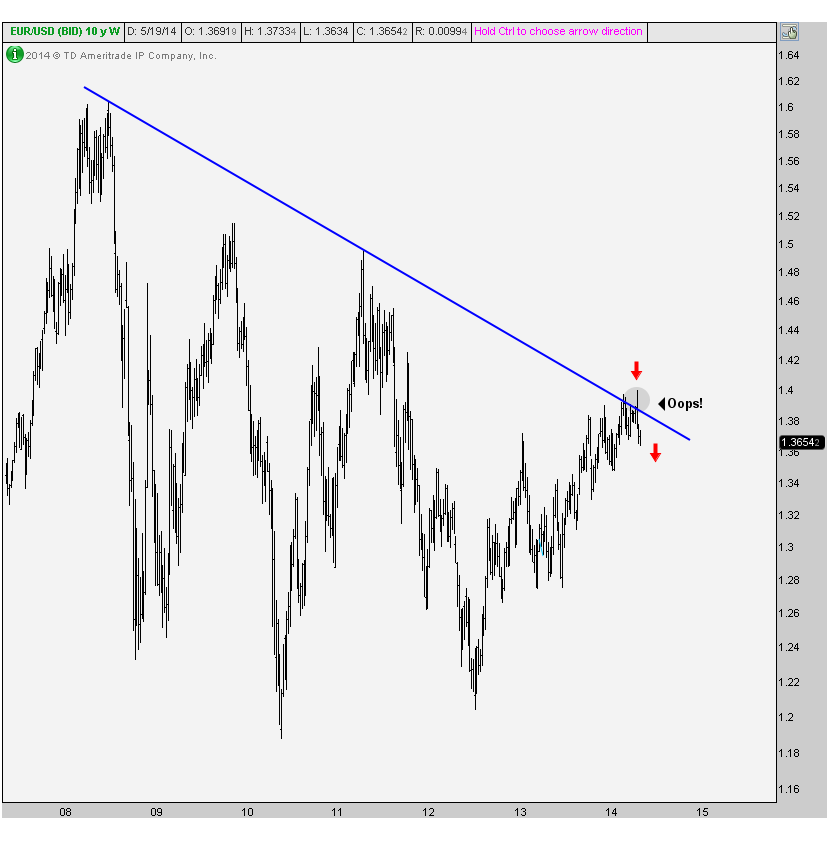

 zerohedge.com /