Monday, February 29, 2016

MRO: Marathon Oil, Putting In a Bottom, $10.50 Target


MOS: Mosaic, Indicators Confirm Bullish Price Breakout


CLR: Continental Resources, Indicators Confirm Price Breakout


LPLA: LPL Financial Holdings


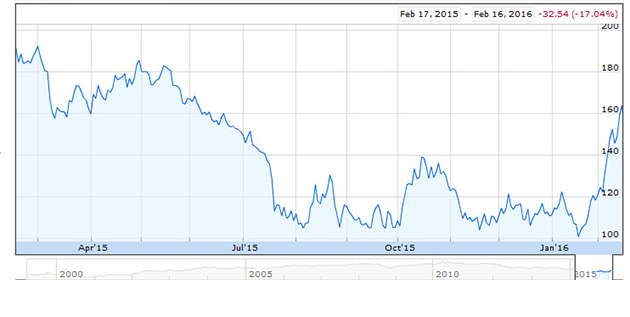
Another stock that's starting to move within range of triggering a big breakout trade is LPL Financial (LPLA - Get Report) , which provides an integrated platform of brokerage and investment advisory services to independent financial advisors and financial advisors at financial institutions in the U.S. This stock has been slammed lower by the sellers over the last six months, with shares down big by 49.6%.

If you take a glance at the chart for LPL Financial, you'll notice that this stock recently gapped-down sharply lower from around $26 a share to its new 52-week low of $15.38 a share with monster downside volume flows. Following that move, this stock has started to rebound off that $15.38 low with a number of strong upside volume days. Shares of LPL Financial trended modestly higher on Thursday right above some near-term support at $17.90 a share with strong upside volume flows. Volume for that trading session registered over 1.73 million shares, which is well above its three-month average action of 1.34 million shares. This high-volume spike to the upside is now quickly pushing this stock within range of triggering a big breakout trade above some key overhead resistance levels.

Traders should now look for long-biased trades in LPL Financial if it manages to break out above some near-term overhead resistance levels at $21 to $21.10 a share and then above more resistance at $21.63 a share with high volume. Look for a sustained move or close above those levels with volume that registers near or above its three-month average action of 1.34 million shares. If that breakout develops soon, then this stock will set up to re-fill some of its previous gap-down-day zone that started near $26 a share.

Traders can look to buy LPL Financial off weakness to anticipate that breakout and simply use a stop that sits right below some key near-term support at $17.90 a share. One can also buy this stock off strength once it starts to move above those breakout levels with volume and then simply use a stop that sits a comfortable percentage from your entry point.

8 Stocks Under $10 Making Big Moves Higher: DSKX, FATE, ONTY, NVET, SIRI, ECA, MRO, SDRL

As part of your daily routine as an active trader or investor, it's important to track the stocks in the market that are making the biggest percentage gains and the biggest percentage losses.
Stocks that are making large moves to the upside are favorites among short-term traders who want to capture some of that massive volatility. Stocks that are making big-percentage moves are usually in play because their sector is becoming attractive or they have a major fundamental catalyst such as a recent earnings release. Sometimes stocks making big moves have been hit with an analyst upgrade or an analyst downgrade.  (more)

US Weekly Economic Calendar

time (et) report period ACTUAL forecast previous
MONDAY, FEB. 29
10 am Pending home sales index Jan.   0.5% 0.1%
TUESDAY,  MARCH 1
9:45 am Markit PMI Feb.   -- 52.4
10 am ISM Feb.   48.6% 48.2%
10 am Construction spending Jan.   0.1% 0.1%
TBA Motor vehicle sales Feb.   17.7 mln 17.5 mln
WEDNESDAY, march 2
8:15 am ADP employment Feb.   205,000 205,000
2 pm Beige book        
THURSDAY, march 3
8:30 am Weekly jobless claims 2/27
270,000 272,000
8:30 am Productivity 4Q   -3.0% -3.0%
8:30 am Unit labor costs 4Q   3.4% 4.5%
10 am ISM nonmanufacturing Feb.   53.4% 53.5%
10 am Factory orders Jan.   2.2% -2.9%
FRIDAY, march 4
8:30 am Nonfarm payrolls Feb.   203,000 151,000
8:30 am Unemployment rate Feb.
4.9% 4.9%
8:30 am Average hourly earnings Feb.   0.2% 0.5%
8:30 am Trade deficit Jan.   -$43.4 bln -$43.4 bln

Wednesday, February 24, 2016

TOL: Toll Brothers, Indicators Showing Signds of a Bottom, Wait for Price Confirmation


MDR: McDermott, All Indicators Bullish, Stock Looks Like It Wants to Move Higher


ZIOP: Ziopharm Oncology Price and Indicators Confirming Uptrend


Analyst Warns the Decline in Stocks is Going to Be Sharp

from King World News
With gold surging and oil tumbling nearly 5 percent, today analyst Tom DeMark sounded the alarm bells regarding the recent stock market rally.
A portion of today’s note from Art Cashin: DeMark Says A Stall Here Could Be A Problem – Here’s a bit from Bloomberg:
The Standard & Poor’s 500 Index’s rally will give way to a full-blown retreat should the benchmark gauge lose altitude over the next few days, according to Tom DeMark, the chart analyst who predicted an advance in oil earlier this month.
Continue Reading at KingWorldNews.com…

Tuesday, February 23, 2016

CMG: Chipotle Mexican Grill, Broke Downtrend Line and Resistance, RSI, MACD, MA, ADX all Confirming Uptrend


CX: Cemex Broke Downtrend Line and First Resistance, RSI, MACD, ADX Confirming, Up We Go


NRG Energy Inc (NYSE: NRG)

NRG Energy, Inc. operates as a power company. The company provides electricity; system power, distributed generation, solar and wind products, backup generation, storage and distributed solar, demand response, energy efficiency, and on-site energy solutions; carbon management and specialty services; and various energy services, such as operations, maintenance, technical, development, and asset management services. The company also offers retail energy, rooftop solar, portable solar and battery products, and home services; and various bundled products, which combine energy with protection products, energy efficiency, and renewable energy solutions, as well as offers installation and contract management services for residential solar customers.
Take a look at the 6 month chart of NRG (NYSE: NRG) below with added notations:


NRG had been in a consistent downtrend up until the beginning of December. After that decline, the stock started trading sideways over the most recent two months. While in that sideways move, the stock has formed a common pattern known as a rectangle. A minimum of (2) successful tests of the support and (2) successful tests of the resistance will give you the pattern.
The NRG rectangle pattern has formed a resistance at $12 , and a $9 support . At some point the stock will have to break one of the two levels.

The Tale of the Tape: NRG is trading within a rectangle pattern. The possible long positions on the stock would be either on a pullback to $9 or on a breakout above $12. The ideal short opportunity would be on a break below $9.

Chart of Day: Cisco (CSCO) Overbought…

After gaining nearly 20% of upside in days, Cisco (CSCO) has become incredibly overvalued, technically. Although fueled by an earnings beat, the stock is up too much, too fast… in need of a near-term correction to the downside.
While fundamentally strong, the momentum crowd has gotten ahead of itself. We can see – just by looking at RSI, MACD and MFI – that the run is beginning to die out. It’s also trading slightly above its upper Bollinger Band with an overbought read of zero on Williams % Range.
That tells us the stock is about to pivot south…
Consider buying to open the CSCO April 2016 27 put up to $1.45.


The Largest M&A Spreads On The Market

According to the latest spreads by Sin Letter, there are currently some huge M&A arbitrage opportunities in the market. However, the bigger the spread, the bigger the risk, and a large spread is often an indication of market skepticism that the deal will ultimately go through.

The largest spread in the market today is the 180 percent spread in the price of Williams Companies Inc WMB , which had agreed to a buyout at $43.50 by Energy Transfer Equity LP ETE  that was expected to close by the end of June 2016. Clearly the massive spread indicates that the market has its doubts about the deal.

The nearest potential closing date on the list is the acquisition of Vivint Solar Inc VSLR  by Sunedison Inc SUNE for $15.25, a deal that was expected to close by the end of March. With Sunedison’s stock now trading below $1.50 and Vivint's spread 163.3 percent, the market doesn’t seem to have much faith in this deal as well.
In addition to the two deals mentioned above, Staples, Inc. SPLS’s potential buyout of Office Depot Inc ODP , Brookfield Infrastructure’s potential deal for Niska Gas Storage Partners LLC NKA  and Halliburton Company HAL's potential acquisition of Baker Hughes Incorporated BHI  round out the top five largest M&A spreads.

Monday, February 22, 2016

TWTR: Twitter, Emerging Signs of a Possible Bottom, Wait


WYNN: Wynn Resorts, Is the Downtrend Finally Over?


NK: NantKwest, Needs to Break Downtrend Line on Volume and Up We Go


What Will Happen In 2016? The Greater Depression? Economic Predictions By Expert John Sneisen

 
Here, author and economic systems expert John Thore Stub Sneisen gives his economic predictions for 2016.

* The Canadian Dollar will continue to crash.

*We will see negative interest rates in most major western countries.

*Oil will hit new record lows.
"Under $20 is very possible as less and less economic demand is forcing the price down as supply is steadily increasing."

*We might see one or more hyper-inflationary events in 2016 "as currencies will get abused and distrusted by the public in several countries."
-Notably Argentina and Venezuela
-Venezuela is seeing a 720% inflation rate this year.

*All out war in the Middle East as Shiites, Sunnis and Jews confront each other.

*2016 Market Crashes.
-Largely due to being pumped up by cheap credit and Quantitative Easing by Central Banks.
-China has recently been forced to buy shares for 230 Yuan in order to desperately keep their massive real estate and commodity bubble afloat and to keep consumer in a certainty market. Bankers are there to make a profit off of you. They will tell you whatever they can to keep you convinced that the markets are fine so they can exit while you buy at record highs.

*Commodities fall further down in a deflationary spiral while Gold might inch up on risk.
-You have to remember that gold is heavily manipulated through the paper gold price GLD on COMEX.
-This will just continue, but we might see a breakout as COMEX is dangerously near default as the paper to gold ratio is at record ponzi-scheme highs!

*Bail In regimes will come as stock markets collapse and banks collapse as they have gambled trillions of dollars that do not exist in derivative products.
-When you have money in a bank account that money is not yours and the bank will use that money to recapitalize itself as they lose money on their derivative betting and gambling.
-Think that bail-ins are something that will never happen? Consider the new legislation in Canada, EU and the US. (See links 1, 2, 3 and 4 below!)

*Corporations will start suing governments as TTP and TTIP and other free trade agreements are in place.
-This legislations makes it possible for big multinational corporations to sue local governments if they have different rules that could hinder them from future profits.
-This is just a gigantic power grab. (see link 5 and 6 below)

*A big terrorist attack in the U.S. to cover up a potentially big market crash?
-They did it in 2001 to cover up the dot com crash which normally unfolding would have crashed the system and global failure would have been imminent.
-Remember the $10k capital control implemented in the banking system after 9/11?
-A great way to strangle people's freedom of currency movement.

*More bankruptcies as more and more debt and unfunded liabilities are strangling local and national governments worldwide.
-We will also see an increase in pensions and other government promises disappearing! So much for the money you paid to these programs.
-Your money will not be safe in Fiat Currencies in 2016! (see link 7)

*Watch out for the IMF and the World Bank as they push more countries into Special Drawing Rights debt.
-They continue to try and spread their currency and strangle economies under water with cheap money that they will never pay back and then they will take your resources, land and infrastructure from you as you default on your IMF loans! (see link 8)

*Bigger inequality problems as governments continue to help bankers and corporations to accumulate more and more power in the economy.
-We don’t have capitalism today in a free market way, instead we have Keynesian government spending and corporate fascism!
-The more money printed and the more QE and lower interest rates, the more power those with access to this cheap money will get!

*More riots and looting as governments and big banks will be pushing division of groups and racism to put them up against each other instead of uniting us all to change the monetary system and governments for the better.

*A big drop in Small and Medium size businesses as more taxation, legislation and rules strangle the most important people in the economy.
-The backbone of any economy.

*The China Debt bubble will unravel as they have seen a massive raise in debt and will de-leverage!

Stay tuned for more!

Ratings Momentum Report

This is the list of the 25 companies that have been upgraded by (or have had their price target increased) brokerages the most during the last ninety days.


Most Upgraded Companies

Please share this article

US Weekly Economic Calendar

time (et) report period ACTUAL forecast previous
MONDAY, FEB. 22
8:30 am Chicago Fed national activity Jan.   -- -0.22
9:45 am Markit PMI flash Feb.   -- 52.4
TUESDAY,  FEB. 23
9 am Case-Shiller U.S. home prices Dec.   -- 5.3% yoy
10 am Consumer confidence Feb.   96.9 98.1
10 am Existing home sales Jan.   5.40 mln 5.46 mln
WEDNESDAY, FEB. 24
10 am New home sales Jan.   528,000 544,000
THURSDAY, FEB. 25
8:30 am Weekly jobless claims 2/20
-- N/A
8:30 am Durable goods orders Jan.   3.3% -5.0%
FRIDAY, FEB. 26
8:30 am Gross domestic product 4Q   0.3% 0.7% (4Q)
8:30 am Advance trade in goods Jan.
-$61.2 bln -$61.5 bln
10 am Consumer sentiment Feb.   91.9 90.7
10 am Personal income Jan.   0.4% 0.3%
10 am Consumer spending Jan.   0.4% 0.0%
10 am Core inflation Jan   -- 0.0%
 

Friday, February 19, 2016

STX: Seagate Technology, RSI, MACD, ADX in place Waiting for Price Breakout


HPQ: Hewlett Packard Price Breakout with RSI, MACD, and ADX confirm Bullish Trend


GME: Gamestop, RSI, MACD, and ADX confirm Bullish Price Trend


Bob Moriarty: Trump Candidacy is Sign of a Falling Empire and a Rising Resource Market

by Karen Roche
The Gold Report

Dramatic daily moves in the U.S. dollar, gold prices and the larger markets are pointing to a global banking collapse that will send resource prices higher in 2016, according to 321gold.com founder Bob Moriarty. In this interview with The Gold Report, he shares his insights on how mining equities will react and five names he is watching.
The Gold Report: Last year at this time we talked about the Swiss decoupling the franc from the euro. Greece was a dark cloud over everything. Now, Europe is not really in the news anymore. China dominates the financial headlines. The Middle East is still a powder keg, and a looming U.S. presidential election has turned into a media circus. What should investors be focusing in on right now?
Bob Moriarty: The world is changing faster than I’ve ever seen before. The Dow Jones Japan Stock Index (JPDOW), the S&P 500, the NYSE Arca Gold BUGS Index (HUI) and the value of the U.S. dollar are moving dramatically every day.
Continue Reading at TheAuReport.com…

Wednesday, February 17, 2016

KMX: Carmax Breakout Should Confirm New Bullish Trend


STT: State Street Corp, Needs to Break Downtrend Line to Confirm Bull


VALE: Companhia Vale do Rio Doce, First $2.80 then $3.50 Next Resistance


UNP: Union Pacific , Needs $80 on Volume to Confirm Bull


The GEO Group Inc (NYSE: GEO)

The GEO Group, Inc. provides government-outsourced services specializing in the management of correctional, detention, and re-entry facilities, and the provision of community based services and youth services in the United States, Australia, South Africa, the United Kingdom, and Canada. It operates through four segments: U.S. Corrections & Detention, GEO Community Services, International Services, and Facility Construction & Design. The company owns, leases, and operates a range of correctional and detention facilities, including maximum, medium, and minimum security prisons; immigration detention centers; minimum security detention centers; and community based re-entry facilities.
Take a look at the 1-year chart of GEO (NYSE: GEO) with the added notations:
1-year chart of GEO (NYSE: GEO)
After declining steadily since April of 2015, GEO has bounced on a clear $25.50 support (green) during the most recent 2 months. Now that the stock appears to be testing that support level again, traders should be able to expect some sort of bounce. However, if the $25.50 support were to break, lower prices should follow.

The Tale of the Tape: GEO has a key level of support at $25.50. A trader could enter a long position at $25.50 with a stop placed under the level. If the stock were to break below the support a short position could be entered instead.

Monday, February 15, 2016

US Weekly Economic Calendar

time (et) report period ACTUAL forecast previous
MONDAY, FEB. 15
  Presidents Day
None scheduled
       
TUESDAY,  FEB. 16
8:30 am Empire state index Feb.   -12.0 -19.4
10 am Home builders' index Feb.   59 60
WEDNESDAY, FEB. 17
8:30 am Producer price index Jan.   -0.2% -0.2%
8:30 am Housing starts Jan.   1.179 mln 1.149 mln
8:30 am Building permits Jan.   -- 1.204 mln
9:15 am Industrial production Jan.   0.4% -0.4%
9:15 am Capacity utilization Jan.   76.7% 76.5%
2 pm FOMC minutes        
THURSDAY, FEB. 18
8:30 am Weekly jobless claims 2/13
275.000 269.000
8:30 am Philly Fed Feb.   -3.0 3.5
10 am Leading indicators Jan.   -- -0.2%
FRIDAY, FEB. 19
8:30 am Consumer price index Jan.   -0.1% -0.1%
8:30 am Core CPI Jan.
0.1% 0.1%
Please share this article

Friday, February 12, 2016

FRPT: Freshpet Inc, Forming Double Bottom with Bullish Divergence on Increasing Volume


SWHC: Smith & Wesson Holding Corp, Looking For a Breakout With Good Volume


BBOX: Black Box Starting a Confirmed Uptrend


TOM DEMARK: The stock market will bottom in the next 2 or 3 days


Tom DeMark thinks that we could be nearing a bottom in the stock market.

In an interview with Bloomberg TV on Thursday, he said that he's looking for one in the S&P 500 over the next couple of days.

DeMark told Bloomberg that he expects we'll find a bottom at 1,792 for S&P 500 futures and 1,797 for the index.

The S&P closed at 1,829 on Thursday. He is a legendary market technician known for making big and specific market-timing calls.

First, however, DeMark thinks that stocks are going to head lower and that this final dive will probably happen "in the next two or three days."

"For the S&P and the Dow, we are going to undercut, in our feeling, the low we made in January as well as the low we made," on Thursday, DeMark said.

The S&P 500's intraday low was around 1,810.
"But we do have one caveat here," DeMark added. "In hectic market, in a market that is going to possibly be attacked with negative news, we could go as low as 1,746 on the [S&P 500] intraday, but still struggle and come back above 1,792 and make a low."

Said another way, stocks could fall about 5% from current levels.

And of course Thursday gave us a perfect example of how sensitive markets are to news when reports — which initially came in the form of a tweet — indicated that OPEC could be open to discussing an oil-production cut.

As for what the — slightly — longer-term future holds, DeMark thinks crude oil could bottom as soon as Friday or Monday while bonds, which rally when yields drop, could top out over the same period.

Gold, DeMark thinks, will probably "go off on its own."

Thursday, February 11, 2016

Here’s Why Cineplex Inc.: CGX Should Be a Core Holding

Cineplex Inc. (TSX:CGX) once again impressed investors with solid results that show increasing attendance and strong performance out of every segment. Here are five trends that lead me to believe that Cineplex should be a core holding in your portfolio.
Strong box office revenues
Box office revenues represented 59% of total revenues in the quarter and 52% of revenues for the year. Revenues increased 13.8% in the fourth quarter and 5.7% for the full year. Breaking this number down, fourth-quarter attendance increased 7.1%, and box office revenue per patron increased 6.3%.  (more)

5 Battered Private Equity Stocks to Buy for a Big Bounce: BX, KKR, CG, APO, OAK

One of the best opportunities in the public equity market right now is in, as strange as it may sound, investing in private equity.
About a decade ago, a slew of the largest and best-run private equity firms starting going public. This was due in good part to let the founders — including investing legends such as Leon Black, Henry Kravis and Henry Schwarzman — create personal liquidity but also benefit by raising capital when stock market performance was strong.
Lately though, the market has been struggling royally, and the PE space has been no exception. Anything related to finance has become a four-letter word, and the stocks of the largest private equity firms have suffered disproportionately. While the market is down around 10% in 2016, the best and brightest PE firms are down much worse — percentages range from the mid-teens to the low 20s.  (more)