Saturday, October 31, 2015

Marin Katusa: Follow the Good Guys in Mining

by JT Long
The Gold Report


The most valuable resource in a mining company is often the people. Good management can attract the right investors and add value regardless of the market. In this interview with The Gold Report, Marin Katusa, founder of Katusa Research, shares his litmus test for which mining companies are worth his hard-won dollars and which ones he is avoiding for the foreseeable future.
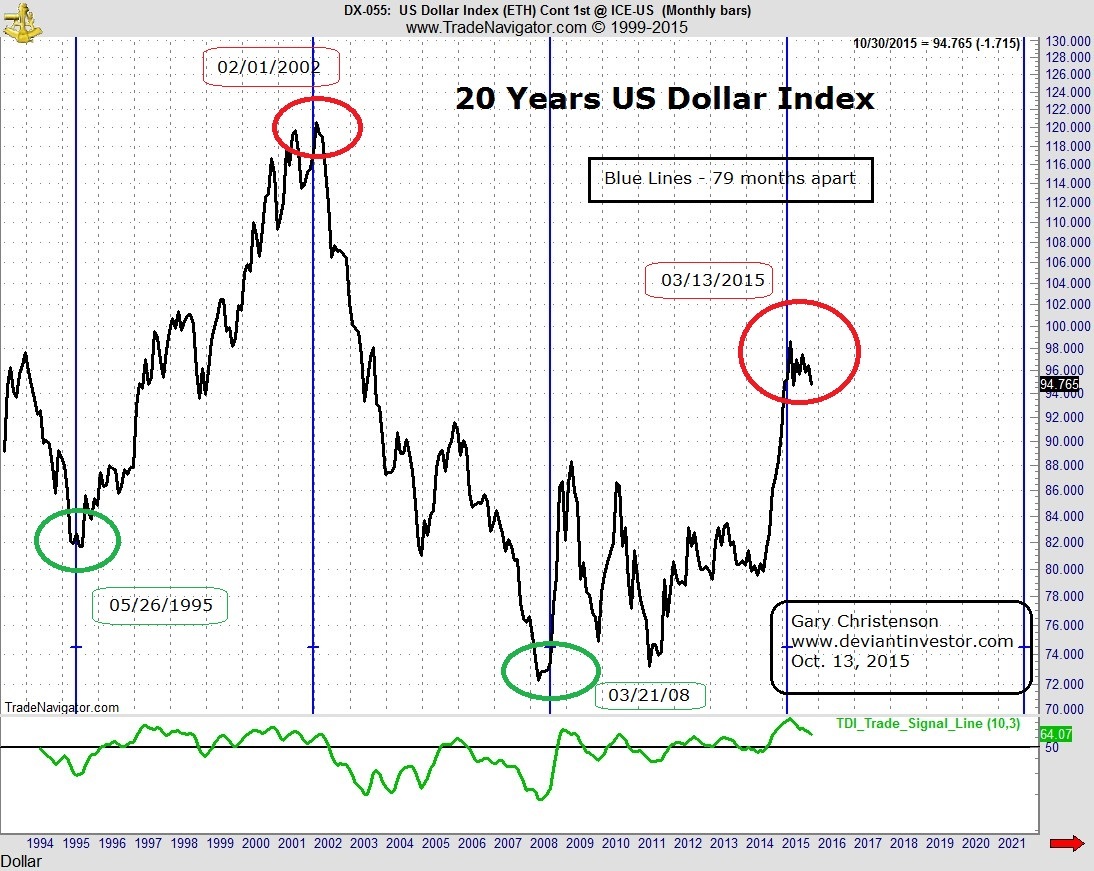
The Gold Report: You seem much more positive about gold right now than when we talked in June. Based on the chart you have on Katusa Research of the U.S. dollar versus gold and in the wake of the Federal Reserve’s inaction at its last meeting, what’s your thesis for gold for the rest of 2015?
Marin Katusa: As I said in the spring, I don’t see the Fed raising rates this year. Using some simple game theory, for the Fed not to raise rates is the best decision. I still believe that. Gold has fared well compared to the price of the U.S. dollar, better than any other hard commodity. Gold is holding its own. The reality is, because the commodity markets are down, very little capital is being invested to replace the production of gold.
Continue Reading at TheAuReport.com…

Rudi Fronk: All That Glitters With Seabridge $SA Is Gold

Introduction: Rudi P. Fronk, Chairman and CEO of Seabridge Gold, has over 30 years experience in the gold business, primarily as a senior officer and director of publicly traded companies. In 1999 Mr. Fronk co-founded Seabridge and has served as the company's CEO since that time. Prior to Seabridge, Mr. Fronk held senior management positions with Greenstone Resources, Columbia Resources, Behre Dolbear & Company, Riverside Associates, Phibro-Salomon, Amax, and DRX. Mr. Fronk is a graduate of Columbia University from which he holds a Bachelor of Science in Mining Engineering and a Master of Science in Mineral Economics.

Anthony Wile: Nice to sit down with you, Rudi. I wrote an editorial recently entitled "Why Most Gold Stocks Are Bad Investments." In it I indicated that very few gold miners actually understood the economics of what they were investing in. I pointed out something I believe deeply, which is that "any company that is in the business of digging real value out of the ground only to exchange it for paper currency is doing a disservice to its shareholders." I'd like you to comment on this.(more)

Alasdair Macleod is Ready to Get On With the Collapse


Applied Materials (NASDAQ: AMAT)

While the semiconductor equipment maker has been steadily moving higher since late September, it is much closer to its 52-week low than high.

Of course, we know the old saw about a rising tide floating all boats doesn't apply when one of those boats has a hole in its hull. A stock with problems such as a serious earnings shortfall or bearish technical trend may not move up just because its sector does.

But Applied Materials has already proven it is a sound "boat." Its chart is displaying positive momentum indicators and increasing cumulative, or on-balance, volume. And shares rallied Wednesday as analysts at Nomura raised their opinion to "buy" from "neutral" with a $22 price target.

What's more, the current rising trend completed a double-bottom pattern similar to that seen in many stocks and sectors at the August and September lows. This "W" shape tells us selling pressures eased on the second dip, and the move above the center of the "W" tells us demand was able to overcome supply at that price.


But we should always step back and see how the pattern fits into the larger context. For that, we can look at a weekly chart below.


Support from the top of a long basing pattern in 2011 and 2012 near $14 is just under the double-bottom. Demand typically picks up at such support levels, and we can feel confident this is what happened with AMAT given the recent upside breakout from the double-bottom.

We can also use the double-bottom to forecast a likely upside target. By measuring the pattern's vertical height and projecting that up from the breakout point we get an objective of $18.15.

Should AMAT keep moving higher, the next target -- an integral multiple of the first -- would be in the $19.95 area, more than 20% above the current price. This is also the 50% retracement of the February-to-September decline and close to the 200-day moving average. Remember that it is not unusual for a stock to move slightly past its major averages, so we use them as guides, not hard support and resistance levels.

I recommend waiting for the current week-long trading range to break up through $16.70 before taking a position to reduce the risk of a false breakout. But given the charts we reviewed today, it looks like this boat will continue to rise for the next few weeks.

Recommended Trade Setup:

-- Buy AMAT above $16.70
-- Set stop-loss at $16
-- Set initial price target at $18.15 for a potential 9% gain in three weeks
-- Set secondary price target at $19.95 for a potential 19% gain in six weeks

Friday, October 30, 2015

Franco-Nevada $FNV: Top Gold Investment

Franco-Nevada (FNV) has made another major streaming deal, using debt for the first time in its history.
The new transaction is a silver stream on the world-class Antamina copper mine. Antamina is the eight largest copper mine in the world and one of the lowest-cost mines in the world
Franco will pay Teck Resources (TCK) $610 million, and in return will receive most of its share of the silver produced from Antamina (starting at 90% and declining to 60% after about 30 years.
The deal is immediately cash flowing and is accretive. It also strengthens and diversifies the portfolio.
On current reserves, the rate of return would be mid-single digits, hardly exciting.
But as Franco notes, they acquire royalties and streams for the upside and fully expect production to grow well beyond current reserves. It is a long-life asset, so Franco expects to participate over several price cycles.
After this transaction, Franco will still have $800 million in available capital. The company has clearly telegraphed that there will be another one or two large transactions.
We think this is a very good deal. It is accretive, it diversifies and strengthens the portfolio, and Franco is buying at a low point in the cycle; finally, this is a world-class asset with a long-life and lots of upside.
Franco sees many opportunities for this type of transaction in the current low commodity price environment. Royalty companies have come a long way from the acquisition of third-party royalties.
The stock has moved strongly from $40 in early September, though it remains below the $60+ level it reached last year.
If you don’t own it already, then buy it here and look for any pullbacks if you are adding to existing positions.

The Probability Of A December Rate Hike Has Never Been Higher

What a difference a word and a day makes...
December odds the highest they have ever been...


Tempur Sealy International Inc (NYSE: TPX)

Tempur Sealy International, Inc., together with its subsidiaries, develops, manufactures, markets, and distributes bedding products worldwide. It operates through two segments, North America and International. The company provides mattresses, foundations, and adjustable bases, as well as other products comprising pillows and other accessories. It offers its products under the TEMPUR, Tempur-Pedic, Sealy, Sealy Posturepedic, Optimum, and Stearns & Foster brand names. The company sells its products through furniture and bedding retailers, department stores, specialty retailers, and warehouse clubs; e-commerce platforms, company-owned stores, and call centers; and other third party distributors, and hospitality and healthcare customers.
Take a look at the 1-year chart of Vera (NYSE: TPX) below with my added notations:
1-year chart of Vera (NYSE: TPX)
TPX has formed a key support level at $70 (green) over the past two months. In addition, the stock is declining against a short-term, down trending resistance level (blue). These two levels combined have TPX stuck within a common chart pattern known as a descending triangle. Eventually, the stock will have to break one of those two levels.

The Tale of the Tape: TPX is sitting within its triangle pattern. A short trade could be made on a break of support or on a rally up to resistance. A long trade could be made at support or on a break through the triangle resistance.

Thursday, October 29, 2015

Breakout in the U.S. dollar

With growing anticipation that the 1st rate increase from the Fed is nearing, the U.S. dollar index broke out of a multi-month consolidation.
The Federal Reserve today hinted that a rate hike was "still on the table at its next meeting" in December.

Traders in response to the more positive tone from the Fed, pushed the dollar higher and out of the consolidation.

The expectation now is that the US$ will gradually advance and start another retest toward par.

Bottom line: The U.S. dollar index broke out of a consolidation that held it since March.

The probability is that the dollar will now advance toward the March high of $1.00 in the weeks to come.

It is important to note that a rising US$ makes commodities less attractive.

This Setup in Natural Gas Is Getting Even Better...

Folks continue to be bearish on natural gas...
 
Last week, I told you the National Oceanic and Atmospheric Administration (NOAA) is predicting a mild winter this year. A warm winter would mean less natural gas consumption.
 
Now, the U.S. Energy Information Administration (EIA) is saying that household natural gas heating bills will fall by 10% this winter.
 
I disagree...
 
Part of the EIA's forecast is based on NOAA's winter prediction. But as I told you last week, I give premium weather service WeatherBELL Analytics' models more credence. The meteorologists at WeatherBELL are predicting a major cold and snowy winter over the South and into the East. And that winter will get a lot worse after December and run late through March.  (more)

Valeant Pharmaceuticals Intl Inc (NYSE: $VRX) near a bottom?


Valeant Pharmaceuticals Intl Inc (NYSE:VRX) This is a stock that could head higher from Wednesday's close. VRX is in the process of bottoming and I expect a pop above $122 very soon. The A/D indicator on chart shows the strength of conviction behind this short-term bullish trend. On radar.

Wyndham Worldwide Corporation (NYSE: WYN)

Wyndham Worldwide Corporation provides hospitality services and products to individual consumers and business customers worldwide. It operates three in segments: Lodging, Vacation Exchange, and Rentals, and Vacation Ownership. The Lodging segment franchises hotels in the upscale, upper midscale, midscale, economy, and extended stay segments, as well as provides property management services for full-service and select limited-service hotels. The Vacation Exchange and Rentals segment provides vacation exchange services and products to owners of intervals of vacation ownership interests (VOIs); and markets vacation rental properties on behalf of independent owners. The Vacation Ownership segment develops, markets, and sells VOIs to individual consumers; and provides consumer financing in connection with the sale of VOIs, as well as offers property management services at resorts.
Take a look at the 1-year chart of Wyndham (NYSE: WYM) below with added notations:
1-year chart of Wyndham (NYSE: WYM)
WYN has been declining ever since it’s beginning of March peak near $93. However, over the past two months the stock had fallen into a common pattern known as a rectangle. A minimum of (2) successful tests of the support and (2) successful tests of the resistance will give you the pattern.
WYN’s rectangle pattern had formed a $80 resistance (green) and a $70 support (blue). At some point the stock had to break one of those two levels, and last yesterday WYN broke the $80 resistance.

The Tale of the Tape: WYN broke out of its rectangle pattern. The ideal long opportunity would be on a pullback down to the $80 level with a stop placed below it. A break back below $80 could negate the forecast for a move higher.

Wednesday, October 28, 2015

Latest Margin Debt Figures Send An Ominous Signal For Stocks


by Jesse Felder, The Felder Report
The NYSE margin debt numbers for the month of September were released today revealing a very significant milestone for the stock market. As of the end of September, both stocks and margin debt have seen their 12-month rate of change turn negative after margin debt-to-GDP had risen above 2.5%. The last time this happened was April of 2008, as the stock market crash during the financial crisis was just getting started. The time before that was December, 2000, the very beginning of the dotcom bust.  (more)

$XHB SPDR S&P Homebuilders (ETF) on the Verge of a Death Cross

SPDR S&P Homebuilders (ETF) (XHB) — This ETF tracks the S&P Homebuilders Select Industry Index. The top 10 holdings in XHB are Helen of Troy Limited (HELE), Williams-Sonoma, Inc. (WSM), Lowe’s Companies, Inc. (LOW), Home Depot Inc (HD), NVR, Inc. (NVR), Allegion PLC, A. O. Smith Corp (AOS), Aaron’s, Inc. (AAN), D.R. Horton, Inc. (DHI) and Restoration Hardware Holdings Inc (RH).
I last recommended XHB as the Trade of the Day for participation in the homebuilding industry on July 10. At the time, the fundamental and technical picture for the group appeared bright, and I said: “This is not a trading recommendation; however, for investors seeking representation in the homebuilder group, XHB is an excellent and relatively inexpensive method of producing solid long-term gains.”

Now, however, labor shortages, higher prices for homes and falling revenues of suppliers have put a price lid on companies in the industry and the homebuilding ETF.

XHB topped on Aug. 19, above $39, but within three days, the ETF days fell to a low under $32. Rather than rebounding and establishing an uptrend, XHB formed a right triangle with bearish implications.

Selling has consistently outpaced buying volume, and the 50-day moving average is just a fraction from crossing through the 200-day moving average, which would result in a death cross — a long-term bearish signal.

Long-term investors who own XHB may want to continue to hold for a recovery in a year or so. But others should sell shares at the market price. Traders should consider buying put options on XHB.

Vera Bradley, Inc. (NASDAQ: $VRA)

Vera Bradley, Inc., together with its subsidiaries, designs, manufactures, and sells handbags, accessories, and luggage and travel items for women of all ages under the Vera Bradley brand. The company offers totes, crossbodies, satchels, clutches, and backpacks bags, as well as baby bags and lunch bags; accessories, such as wallets, wristlets, eyeglass cases, jewelry, and scarves; and travel products comprising rolling luggage, cosmetics, and travel and packing accessories, as well as travel bags consisting of duffel and weekend bags. It also provides home products, including mugs and tumblers, as well as textiles products, such as aprons, beach towels, throw blankets, and comforters; offers apparel/footwear, stationery, merchandising, and gift card products; and licenses its products. The company sells its products through two segments, Direct and Indirect.
Take a look at the 1-year chart of Vera (NASDAQ: VRA) below with my added notations:
1-year chart of Vera (NASDAQ: VRA)
VRA has formed a key support level at $12 (green) over the past two months, which had also been a prior resistance back in July. In addition, the stock is declining against a short-term, down trending resistance level (red). These two levels combined have VRA stuck within a common chart pattern known as a descending triangle. Eventually, the stock will have to break one of those two levels.

The Tale of the Tape: VRA is sitting within its triangle pattern. A short trade could be made on a break of support or on a rally up to resistance. A long trade could be made at support or on a break through the triangle resistance.

Tuesday, October 27, 2015

Silver Analysis COT Chart

Let’s start first with the daily chart.
Silver has had a good start to the month of October but looks like it has run into a pretty solid wall of overhead resistance as we wind down the month. The sellers have come out in force near the $16 level and in the process, have managed to prevent the bulls from besting the 200 day moving average. As you can see on the chart, that moving average has held the market in check. (more)

Get a 7 Piece Mini Multi Tool for FREE

Bottom Fishing in Brazil: Petrobras $PBR, Brazil iShares ETF $EWZ

In retrospect, it was a clear sign of a market top…
A few years ago, I was waiting to speak as an energy specialist was wrapping up his presentation. He closed with a recommendation of Brazil’s energy giant Petrobras (PBR), boldly predicting that its market value could reach more than a trillion dollars.
While Petrobras stock reached $71 in 2007, it now trades under $5.
And just last month, Brazil itself lost the coveted investment grade status it earned in 2008. (more)

Larry Berman: A sobering look at investing in real estate

ANALYSIS: The goal of today’s post and of the Berman’s Call housing panel debate in Vancouver, Calgary, and Toronto is to attempt to enlighten and perhaps shed a point of view on the housing sector in Canada as an investment. Please, please, please don’t go out and sell your house--we all need a place to live. But if you are speculating or investing in real estate it might be helpful to join the discussion @LarryBermanETF and #bermaneducation.
My guest today is Rob Carrick of the Globe and Mail who will be participating in our Real Estate Panel at our Toronto Berman’s Call tour event on November 29. Rob has been a personal finance columnist with the G&M since 1998 and is a great advocate for Canadians. (more)

Shutterstock Inc (NYSE: SSTK)

Shutterstock, Inc. operates as an online marketplace for commercial digital content imagery. It offers various photographs covering a range of subjects, including animals/wildlife, the arts, backgrounds/textures, beauty/fashion, buildings/landmarks, business/finance, celebrities, education, food/drink, healthcare/medical, holidays, nature, objects, people, religion, science, sports/recreation, technology, transportation; illustrations and vector art; curated premium imagery; and video footage for users engaged in video advertisements, commercial motion pictures, television programming, video games, interactive applications, and other video-based media.
Take a look at the 1-year chart of Shutterstock (NYSE: SSTK) below with added notations:
1-year chart of Shutterstock (NYSE: SSTK)
SSTK broke its $55 level of support back in July and the stock has been declining ever since. However, over the past two months the stock has fallen into a common pattern known as a rectangle. A minimum of (2) successful tests of the support and (2) successful tests of the resistance will give you the pattern.
SSTK’s rectangle pattern had formed a $35 resistance (blue) and a $29 support (red). At some point the stock had to break one of those two levels, and last week SSTK broke the $29 support.

The Tale of the Tape: SSTK broke down from its rectangle pattern. The ideal short opportunity would be on a rally up to or near the prior $29 support. A break back above $29 could negate the forecast for a move higher.

Monday, October 26, 2015

Blackberry $BBRY, Apple $AAPL, Facebook $FB


BlackBerry Ltd (NASDAQ:BBRY) after a big surge early this month, the stock has been consolidated in a very good pattern, creating a flag formation on the daily chart. This is typically a bullish continuation pattern. Friday's move it seems to have broken the flag's upper boundary, however we need a clear violation next week, followed by a break of the intermediate resistance at 7.45. Based on the technical chart, I see a high probability for a continuation of current momentum and a move toward the 8-8.25 area. BlackBerry has already opened-up pre-orders for its Android smartphone, known as the Priv, a high-end QWERTY slider phone with a fantastic battery life and great camera. Blackberry Priv might be the most secure Android phone ever. This could be a good catalyst for shares.


Apple Inc.(NASDAQ:AAPL) broke out of a large sideways channel pattern on solid volume, closing at the highest price in almost two months. If momentum continues, we could see the stock hit 130 over the next couple of sessions, but keep mind, Apple will report earnings on Tuesday afternoon, so everything can happen.


Facebook Inc (NASDAQ:FB) recorded a new high in Friday's session. Short-term outlook for the stock is bullish. Buy the stock in dips with a stop-loss at $98.88. The daily technical chart looks very Bullish with all EMAs going up and MACD on top of "0". Long setup.
  

Tahoe Resources Inc (NYSE: TAHO)

Tahoe Resources Inc., together with its subsidiaries, explores for and produces precious metals in the Americas. The company primarily produces silver, as well as gold, lead, and zinc. Its principal project is the Escobal project located in Southeast Guatemala. The company was formerly known as CKM Resources Inc. and changed its name to Tahoe Resources Inc. in January 2010. Tahoe Resources Inc. was incorporated in 2009 and is headquartered in Reno, Nevada.
Take a look at the 1-year chart of Tahoe (NYSE: TAHO) below with added notations:
1-year chart of Tahoe (NYSE: TAHO)
After declining steadily over the course of the past year, TAHO started trading in a mostly sideways move. While in this sideways move, the stock formed two important price levels to be aware of. The first level to notice is the resistance at $10 (red). The other level TAHO created would be the $7.50 support (green).

The Tale of the Tape: TAHO is trading between two key price levels. The possible long positions on the stock would be either on a pullback to $7.50 or on a breakout above $10. The ideal short opportunity would be on a break below $7.50.

US Weekly Economic Calendar

time (et) report period ACTUAL forecast previous
MONDAY, OCT. 26
10 am New home sales Sept.
550,000 552,000
TUESDAY,  OCT. 27
8:30 am Durable goods orders Sept.   -1.5% -2.3%
10 am Consumer confidence index Oct.   101.0 103.0
WEDNESDAY, OCT. 28
8:30 am Advanced trade in goods Sept.   -$64.8 bln -$67.2 bln
THURSDAY, OCT. 29
8:30 am Weekly jobless claims Oct. 17   N/A N/A
8:30 am Gross domestic product 3Q   2.1% 3.9%
FRIDAY, OCT. 30
8:30 am Personal income Sept.
0.2% 0.3%
8:30 am Consumer spending Sept.   0.1% 0.4%
8:30 am Core Inflation Sept.   0.2% 0.1%
8:30 am Employment cost index 3Q   0.6% 0.2%
10 am Consumer sentiment index Oct.   -- 92.1
 

Saturday, October 24, 2015

3 Monthly Dividend Stocks Yielding Up to 10%: $BDI, $KEY, $REF.UN

If you’re interested in earning monthly dividend income, you’ve come to the right place. I’ve scoured the market and compiled a list of three stocks from three different industries that pay dividends on a monthly basis, so let’s take a quick look at each to determine which would be the best fit for your portfolio.
1. Black Diamond Group Ltd.: 10% yield
Black Diamond Group Ltd. (TSX:BDI) rents and sells portable workforce accommodations and work space solutions to businesses in Canada, the United States, and Australia. It pays a monthly dividend of $0.08 per share, or $0.96 per share annually, giving its stock a 10% yield at today’s levels.  (more)

Gold Stocks Have NEVER Been This Cheap

Gold stocks soared 600% from 2000 to 2004...
 
Before then, gold stocks had fallen 84% from 1996 to 2000.
 
The question is, are gold stocks cheaper today than they were back then?
 
The answer is YES. Let me explain...
 
Most investors know that gold is far from its 2011 highs. But I don't think folks understand how far gold stocks have fallen. (more)

Teradata Corporation (NYSE: TDC)

Teradata Corporation provides analytic data platforms, marketing and analytic applications, and related services in the United States and internationally. Its analytic data platforms comprise software, hardware, and related business consulting and support services for data warehousing and big data analytics. The company’s products comprise Teradata Database Software that delivers near real-time intelligence; Teradata Workload-Specific Platforms; Teradata Aster Discovery Platform, which is pre-configured with Teradata Aster Database; Teradata Portfolio for Hadoop; and Teradata QueryGrid that provides access to analytics to various processing engines.
Take a look at the 1-year chart of Puma (NYSE: TDC) below with added notations:
1-year chart of Puma (NYSE: TDC)
After the stock’s summer decline, TDC has now started trading sideways over the most recent two months. While in that sideways move, the stock has formed a common pattern known as a rectangle. A minimum of (2) successful tests of the support and (2) successful tests of the resistance will give you the pattern.
TDC’s rectangle pattern has formed a resistance at $30 (red), and a $28 support (green). At some point the stock will have to break one of the two levels.
The Tale of the Tape: TDC is trading within a rectangle pattern. The possible long positions on the stock would be either on a pullback to $28 or on a breakout above $30. The ideal short opportunity would be on a break below $28.

Bye, Bye Euro

So how does it fell Mr. Euro to get smacked upside the head by your supposed caretaker?
Mario Draghi must be taking lessons from the Bank of Japan because this is one of the best verbal whoopin’s I have seen put on a currency.
Mario yanked the rug out hard; so hard, that the basement is now evident.
I do not wish to get too dramatic here but the truth is that the Europeans simply do not want the Euro above 1.140 and they did their best to take it down. Traders can take away from his comments today that they will have the ECB at their back if the Euro starts getting too goofy to the upside. that will enable to sell rather comfortably up there should the Euro revisit that level. It would take some sort of huge sea change in sentiment tied to a fundamental development for the ECB to tolerate the Euro above 1.14-1.15 based on what Mr. Draghi said today. (more)

Friday, October 23, 2015

JC Penney $JCP, Amkor Technolog $AMKR


J C Penney Company Inc (NYSE:JCP) looks to have consolidated and may be getting ready for another leg higher. The stock needs to break out above $10.09 to go higher.


Amkor Technology, Inc.(NASDAQ:AMKR) looks ready to break a recent high of $5.62. Technical indicators are looking positive with the RSI and MACD rising. Keep it on your watch list going forward.

Nordic American Tanker Ltd (NYSE: NAT)

Nordic American Tankers Limited, a tanker company, engages in acquiring and chartering double-hull tankers. As of December 31, 2014, it owned 24 Suezmax crude oil tankers, including two new buildings under construction. The company was founded in 1995 and is based in Hamilton, Bermuda.
Take a look at the 1-year chart of Nordic (NYSE: NAT) below with added notations:
NAT moves closer to a breakout
Overall, NAT has been trending higher throughout most of 2015. Twice over the past 3 months the stock has hit the same resistance at $17 (red). Last week the stock tried again to break above that mark, but failed once more. A close above the $17 should lead to a significant leg higher for NAT.

The Tale of the Tape: NAT has a 52-week resistance at $17. The possible long position on the stock would be on a breakout above that level with a stop placed under it.

US Dollar Decline Cycle


The US Dollar Index hit a low in 1995, a high in 2002, a low in 2008, and a recent high in 2015.  Examine the following 20 year chart of the dollar.


Note that the vertical blue lines are 79 months apart and show approximate low, high, low, and high cycle extremes.  I have noted the dates for the weekly low and high closes near the green and red circles.  (more)

Chart of the Day Hawaiian Holdings (HA)

Since the Trend Spotter signaled a buy on 9/11 the stock gained 28.88%.

Hawaiian Holdings is a holding company of Hawaiian Airlines. Hawaiian Airlines is the largest airline headquartered in Hawaii. They are engaged primarily in the scheduled transportation of passengers, cargo and mail. Scheduled passenger service consists of daily service between Hawaii and Las Vegas, Nevada and the four key United States West Coast gateway cities of Los Angeles and San Francisco, California, Seattle, Washington and Portland, Oregon; daily service among the major islands of Hawaii; and bi-weekly service to Pago Pago, American Samoa, Papeete and Tahiti.

Barchart technical indicators:

  • 100% Barchart technical buy signals
  • 119.60+ Weighted Alpha
  • Trend Spotter buy signal
  • Above its 20, 50 and 100 day moving averages
  • 12 new highs and up 27.68% in the last month
  • Relative Strength Index 78.39%
  • Barchart computes a technical support level at 27.96
  • Recently traded at 32.08 with a 50 day moving average of 25.24
Fundamental factors:
  • Market Cap $1.76 billion
  • P/E 11.57
  • Revenue expected to decline .20% this year but increase again by 4.10% next year
  • Earnings estimated to increase 91.00% this year, an additional 6.80% next year and continue to compound at an annual rate of 29.30% for the next 5 years
  • Wall Street analysts issued 2 strong buy, 2 buy, 3 hold and 2 under perform recommendations on the stock

Thursday, October 22, 2015

Will These Stocks Plunge Next? : $VRX, $APD, $MDLZ, $PAH, $ZTS, $QSR, $VRX

With Valeant having collapsed over 30% today alone, now under $100 for the first time in a year (from highs over $260 in August 2015):


Someone just dumped a bucketload of VRX...(more)

The Key SP500 Price Pivot Planning Level to Trade

What’s the current major “Bull/Bear” Pivot Price for the S&P 500? On what level should we be focusing?
Let’s take a laser-like focus on this price level and plan our strategy for the rest of the week.
Here’s the simple pivot in the S&P 500:

Our key focal point is 2,033 (technically 2,030 to 2,040) for this week’s bull/bear pivot planning.
This level reflects the 61.8% “last line in the sand” Fibonacci Retracement of the August collapse and recovery.
Ultimately, what happens here determines whether we are “ignore it all” buyers (bulls) above 2,040 or cautiously bearish, anticipating another pullback from resistance.  (more)

Stocks to Watch: $CAM, $AAPL


Cameron International Corporation (NYSE:CAM) is setting up for another run. Lets see if it breaks over $67.61. Long set-up on watch.


Apple Inc. (NASDAQ:AAPL) could breakout at any moment IMO Next buy point when clears 117 on heavy volume. The MACD momentum is rising and RSI is on a decent uptrend, which when combined with the strengthening MACD could spell a nice move for the stock.
 

Dycom Industries, Inc. (NYSE: DY)

Dycom Industries, Inc. provides specialty contracting services in the United States and Canada. The company offers a range of specialty contracting services, such as engineering, construction, maintenance, and installation services comprising placement and splicing of fiber, copper, and coaxial cables to telecommunications providers. It also provides underground facility locating services, including locating telephone, cable television, power, water, sewer, and gas lines to various utilities, which comprise telecommunications providers. In addition, the company offers tower construction, lines and antenna installation, and foundation and equipment pad construction services for wireless carriers, as well as equipment installation and material fabrication, and site testing services; and installs and maintains customer premise equipment, such as digital video recorders, set top boxes, and modems for cable television system operators.
Take a look at the 1-year chart of Dycom (NYSE: DY) below with my added notations:
DY ascending
DY has hit resistance at $80 (red) multiple times over the past couple of months. In addition, the stock has been climbing a trend line of support (green) since the beginning of September. Eventually, the stock will have to break either the $80 resistance, which would be a 52-week high, or the trendline support.

The Tale of the Tape: DY is winding up between two key levels. A long trade could be made at the trendline support or on a break above $80. A break below trendline would be an opportunity to enter a short trade.

Wednesday, October 21, 2015

Netflix $NFLX: The Most Overvalued Value on the Street

Netflix (NFLX) stock slapped the bulls in the face last week, or did it?
The company announced that it had fallen short of Wall Street earnings estimates by a penny when it earned 7 cents per share for the latest quarter.
As we all know by now, the stock immediately shed about 10% to trade back to $100, where it sits just below now.
So the question is, do you buy, hold or sell from here? (more)

Skechers USA Inc (NYSE: SKX)

Skechers U.S.A., Inc. designs, develops, markets, and distributes footwear for men, women, and children, as well as performance footwear for men and women under the Skechers GO brand name worldwide. It operates through four segments: Domestic Wholesale Sales, International Wholesale Sales, Retail Sales, and E-commerce Sales. The company offers casual footwear, including boots, shoes, and sandals for men, as well as oxfords and slip-ons, lug outsole and fashion boots, and casual sandals for women; dress casuals, seasonal sandals and boots, and relaxed fit casuals for men and women; casual fusion line for young men and women under the Skechers USA brand.
Take a look at the 1-year chart of Skechers (NYSE: SKX) below with my added notations:
1-year chart of Skechers (NYSE: SKX)
SKX has formed an important support level at $40 (green) over the past three months. In addition, the stock is declining against a short-term, down trending resistance level (red). These two levels combined have SKX stuck within a common chart pattern known as a descending triangle. Eventually, the stock will have to break one of those two levels.

The Tale of the Tape: SKX is within a triangle formation. A short trade could be made on a break of support or on a test of resistance. A long trade could be made at support or on a break through the triangle resistance.

Twitter $TWTR Stock Could Fly 30% Higher

Twitter Inc (TWTR) — I recommended TWTR stock as the Oct. 9 Trade of the Day based on a bullish chart pattern, along with the company’s ability to double its revenues since its November 2013 IPO and finally turn a profit.

On Oct. 13, the social media company announced it would lay off up to 336 employees, or about 8% of its workforce. New management said the restructuring is part of a plan to increase efficiency and savings will be invested in growth areas.

Twitter also preannounced it expected Q3 revenue and earnings to meet or exceed the high end of its previously projected range. The company is scheduled to report quarterly results on Oct. 27.

The news prompted S&P Capital IQ Equity Research to reiterate its “strong buy” on TWTR stock.
As I mentioned earlier this month, shares completed a “W” double-bottom reversal from a bear market that began in late April at over $55.

Following my buy recommendation, TWTR stock broke from the “W” into a bullish “flag.” The top of the flag is at Monday’s high at $31.60. The formation is supported by higher-than-average buying volume and very low selling volume.

Initial resistance is at the 200-day moving average at $37.70. If the company delivers a strong earnings report next week, we can expect this resistance level to be pierced.

Buy TWTR stock at the market with a short-term trading objective of $40 for a potential gain of almost 30%. Traders should enter a stop-loss order at $28.

Investors may also want to buy shares as a long-term hold in the information technology sector.

Tuesday, October 20, 2015

Charles Nenner: The Whole Economy is Turning Down


On the economy, Renowned analyst Charles Nenner predicts, “If you look at the business cycle, then you see the whole thing is turning down. It’s very regular. The problem is that we are not turning down from a GDP at 6%, we are turning down from a GDP of 1%. So, soon we are going to be very negative, and we are going to be in for a very negative deflationary crisis. It doesn’t mean the stock market is going to collapse now. It’s going to be the end of 2017. It’s one and a half years away. I think we could rally before the end of the year, but it will be a catastrophe in 2017. The Dow is going to 5,000 . . . by 2021. I have been saying this for years. If you are not safe before 2017, you can lose everything you have.”

Also, on the economy, Nenner warns, “It’s going to be very bad. My cycles show now unemployment is going up, which is another deflationary problem. Profits of companies will be very bad. . . . Everything is going to turn down. . . . The dollar is getting ready to go into a bear market, and next year will be the year of the Euro.”

On gold and silver, Nenner says, “I don’t think it will test the lows again, and it will take off in the first quarter of next year.”

Vulcan Materials Company (NYSE: VMC)

Vulcan Materials Company produces and sells construction aggregates, asphalt mix, and ready-mixed concrete primarily in the United States. It operates through four segments: Aggregates, Asphalt Mix, Concrete, and Calcium. The Aggregates segment offers crushed stone, sand and gravel, sand, and other aggregates, as well as related products and services. The Asphalt Mix segment offers asphalt mix in Arizona, California, and Texas. The Concrete segment produces and sells ready-mixed concrete in Georgia, Maryland, New Mexico, Texas, Virginia, Washington D.C., and the Bahamas. The Calcium segment mines, produces, and sells calcium products for the animal feed, paint, plastics, water treatment, and joint compound industries.
Take a look at the 2-year chart of Vulcan (NYSE: VMC) below with my added notations:
2-year chart of Vulcan (NYSE: VMC)
Over the past 3 months VMC has created a key level of support (red) at $85. That line is also the “neckline” for the stock’s head and shoulders (H&S) reversal pattern. Above the neckline you will notice the H&S pattern itself (blue). Confirmation of the H&S would occur if VMC breaks the support, and lower prices would be expected from there.

The Tale of the Tape: VMC has formed a head & shoulders pattern. A long trade could be made at $85 with a stop placed below that level, but ideally, the pattern implies a short trade to be entered on a break below that level instead.

Honeywell $HON Stock Breaking Down From 4-Year Bull Market

Honeywell International Inc. (HON) — This is the world’s largest manufacturer of electronic systems used on aircraft, small jet engines and climate control equipment. Honeywell also makes industrial materials and automotive products.

On Friday, the company reported third-quarter earnings of $1.60 per share, up from $1.47 a year ago and beating the consensus estimate of $1.55. But revenue of $9.61 billion fell from $10.11 billion last year and missed estimates of $9.85 billion.

For the full year, S&P Capital IQ Equity Research forecasts revenue will decline 3% based in part on weak U.S. defense sales and currency headwinds. Its analysts also note additional weakness in the global economy could negatively impact the stock.

On Aug. 21, HON stock broke down from a bull market that had lasted more than four years. As with many stocks, the Aug. 24 low appeared to be a short-term low and perhaps even a bottom.
However, on a rebound, HON stock failed to successfully challenge its 200-day moving average, falling below $92. A subsequent rally failed again to successfully challenge the 200-day moving average at $102.

HON stock closed 1.5% lower on very high volume following Friday’s earnings announcement. The current pattern is that of a bearish “horn.”Traders should sell HON stock short at $99 with a target of $85 for a potential gain of 14%. A stop-loss order should be entered at $104.

If you hold shares short through Honeywell’s ex-dividend date, expected in mid-November, you will be required to pay the dividend to the owner of the stock. The company pays a quarterly dividend of 51 cents per share for a current forward annual yield of 2.1%. Also, check with your broker for any unusual restrictions on shorting this or any other stock.

Monday, October 19, 2015

Twitter $TWTR, Aerie Pharmaceuticals $AERI, Arena Pharma $ARNA


Twitter Inc (NYSE:TWTR) had a strong bullish momentum on Friday after Steve Ballmer reveals 4% stake. The stock closed the day with a gain of 4.85 per cent at 31.15 on strong volume after touching the day's high of 31.40. From a technical standpoint, the bias is bullish in nearest term. Key resistance is seen at 31.50. A clear break and daily close above this area could trigger further bullish momentum testing 33.51 or higher. The stock stayed above the 50-day EMA and the MACD and RSI still in buy mode. Long setup.


Aerie Pharmaceuticals Inc (NASDAQ:AERI) attempted to push lower on Friday bottomed at 20.50 but quickly whipsawed to the upside and closed slightly below the key resistance zone. A clear break and consistent movement above the 21.43 level next week could trigger further bullish pressure testing the 25.50 area. MACD is about to trigger a new buy signal with Slow Stochastic pointing upwards. Long setup on watch.


Arena Pharmaceuticals, Inc. (NASDAQ:ARNA) Will watch to see if it can break this horizontal resistance line next week. Key momentum indicators are trending in a positive direction. The bias remains bullish but the 2.54 area needs to be clearly broken to the upside to continue the bullish scenario. The immediate support is seen around 2.24/2.26.

Discovery Communications Inc. (NASDAQ: DISCK)

Discovery Communications, Inc. operates as a media company. The company operates through U.S. Networks; International Networks; and Education and Other segments. The company owns and operates television networks under the brands, such as Discovery, TLC, Animal Planet, Investigation Discovery, Science, Velocity, Discovery Family, American Heroes, Destination America, Discovery Life, Oprah Winfrey network, Eurosport, DMAX, and Discovery Kids. Its content spans genres, including survival, exploration, sports, lifestyle, general entertainment, heroes, adventure, crime and investigation, health, and kids. The company also distributes content across various platforms, such as brand-aligned Websites, Web-native networks, on-line streaming, mobile devices, video on demand (VOD), and broadband channels; and operates radio stations and Websites.
Take a look at the 1-year chart of Discovery (NASDAQ: DISCK) below with the added notations:
1-year chart of Discovery (NASDAQ: DISCK)
DISCK has been taking gradual steps lower throughout the past year. Along the way, the $28 price level (purple) has become very important to the stock, specifically over the past 9 months. Not only was $28 a key support back in January and May, that level has also been hit as resistance a couple of times in August.

The Tale of the Tape: DISCK has a key level at $28. A trader could enter a long position on a break above $28 with a stop placed under the level. However, if traders are bearish on the stock, a short trade could be made instead at the $28 resistance.

Philip Morris Intl. Inc. (PM)

Company Profile: Philip Morris International Inc., through its subsidiaries, manufactures and sells cigarettes, other tobacco products, and other nicotine-containing products. Its portfolio of brands comprise Marlboro, Merit, Parliament, Virginia Slims, L&M, Chesterfield, Bond Street, Lark, Muratti, Next, Philip Morris, and Red & White. 

Fundamentals:
Trailing P/E: 18.89
Forward P/E: 18.64
EPS: 4.65
Beta: 1.048
PEG: 4.98
P/S: 4.83
Profit Margin: 26.22%
Operating Margin: 40.89%
ROA: 20.93%
Qtrly Earnings Growth (yoy): -9.90%
Current Ratio: 1.00

Additional fundamental data: http://finance.yahoo.com/q/ks?s=PM

Technicals:
Recently broke out of a 28-month consolidation
New 52-week high
New all-time high
Buying momentum is positive and rising
Buying volume is neutral
Accumulation is rising and at a 5-year high
PM is outperforming the S&P 500 since July 2015
Support is at $86

The safety stop is at $84

The target is at $100

Note: If PM moves past the target, we suggest using a 3% trailing stop.

Gold Forecast: Time For A Top And Then Another Drop

In this updated gold price forecast, we will look at short, intermediate and long-term gold price targets. I also have a silver price forecast explaining the possibilities of a $300 price target for silver and how I plan to turn precious metal profits into lasting wealth. Our unique approach combines cycles work with technical analysis to give estimated market timing and potential target areas. Current indicators suggest the gold price is close to forming a top and once formed prices should head lower into a biannual cycle low by year end. In the remainder of this exclusive gold forecast we will focus on various price charts and give brief summaries of the present technical environment.

Since this correction began in 2011, prices have stayed in somewhat of a predictable pattern. This pattern includes gold prices forming biannual cycle tops within certain time parameters and prices holding to specific moving averages. The daily chart pictured below shows prices are now attacking the downward sloping 200-day moving average (pink line at $1,176.29). Gold prices have struggled with the 200-day moving average and therefore, this seems like a potential termination area. If prices close above $1,206 for more than two days in a row, I will be forced recalculate the target area. Our premium newsletter is focused on identifying topping patterns and we will alert subscribers once confirmed. Note: The slow stochastics indicator (shown above the price) is in overbought territory, a crossover from this area has often signaled the biannual cycle top.  (more)

US Weekly Economic Calendar

time (et) report period ACTUAL forecast previous
MONDAY, OCT. 19
10 am Home builders' index Oct.
62 62
TUESDAY,  OCT. 20
8:30 am Housing starts Sept.   1.141 mln 1.126 mln
WEDNESDAY, OCT. 21
  None scheduled        
THURSDAY, OCT. 22
8:30 am Weekly jobless claims Oct. 10   265,000 255,000
10 am Existing home sales Sept.   5.33 mln 5.31 mln
FRIDAY, OCT. 23
  None scheduled  


Saturday, October 17, 2015

Corn: Buy or Sell?

From a 30 year cycle point of view, corn is starting to look very interesting.  While it could still take several weeks to see if corn will bottom above the 360 price level,  this is a market that could offer a low risk/high reward trading opportunity if the October 2015 corn pattern continues ‘shadowing’ the October 1985 corn pattern.  As highlighted on the first chart below, corn bottomed in October 1985 and then rallied into December 1985:
December 1985 daily corn chart
1016151
December 1985 corn futures reached an initial low on Sept 4  that was tested the following week.  As the chart shows, following the re-test of the Sept 4 low corn rallied and - over the next two weeks - was able to trade back up above the 10 and 13 day EMA’s.  Also noteworthy is at that time corn was bottoming,  the 10 and 13 day EMA’s (red/green lines) were positioned below the 55 day EMA (blue line) and corn was trading below all three EMA’s.(more)

The Stock Market $NYSE is Overbought

The stock market is even more overbought today than it was last week.
Over the past two weeks, we saw the S&P 500 rally as much as 7.5%. That's a remarkable move. And the proverbial rubber band is now stretched far to the upside.
It can stretch further. Overbought conditions can get even more overbought.
But the odds are against it...
Too many technical indicators are now at levels that often coincide with a short-term top in the stock market.
For example, take a look at the charts below. They show the McClellan Oscillators for the New York Stock Exchange (NYSE) and the Nasdaq at Friday's close...
The McClellan Oscillator is an indicator of overbought and oversold conditions. It's generally considered to be oversold when it falls to less than -60. It's overbought when it rallies to more than 60.
As you can see from the charts, both the NYSE and the Nasdaq McClellan Oscillators closed Friday at the most overbought readings of the year.
And the Volatility Index (VIX), a contrary measure of investor sentiment, has collapsed from where it was a few weeks ago...
The VIX closed Monday at 16.17 – just a fraction higher than its lower Bollinger Band. This represents an extreme move to the downside.
The VIX often rallies off of this sort of oversold condition. And a strong rally in the VIX is usually accompanied by a strong decline in the broad stock market.
The stock market has held up well since I turned cautious on it last week. But with so many technical indicators at levels that often precede a broad stock market decline, it's hard to argue that the market is headed even higher in the near term.
Traders need to be cautious here. Tighten your stops. Trim your profits. And brace yourself for a big move to the downside.