Tuesday, April 21, 2015

The 3 Best Stocks to Invest in Gaming: Electronic Arts (NASDAQ: EA ) , Activision Blizzard (NASDAQ: ATVI ) , and Take-Two (NASDAQ: TTWO )

The market for video games has been strong over the past few years. From 2009 to 2012, the video game industry grew four times faster than the overall U.S. economy, and that growth is projected to continue in the years ahead.
Investors looking to get exposure to this industry have a variety of options, but Electronic Arts (NASDAQ: EA  ) , Activision Blizzard (NASDAQ: ATVI  ) , and Take-Two (NASDAQ: TTWO  ) are three of the best companies in the space.
Electronic Arts could deliver the best-selling game of 2015
Electronic Arts was one of the single best performing tech stocks in 2014. Shares of the publisher more than doubled, as sales of several of its key titles, including Titanfall and Dragon Age: Inquisition, exceeded expectations. That surge has given Electronic Arts a more aggressive valuation than some of its rivals, but the stock could continue to deliver in the quarters to come.  (more)

Please share this article

Builders Beggar Belief As Lumber Liquidation Looms

With lumber prices plunging to fresh 3 year lows, the divergence between homebuilders and the most economically-sensitive commodity is starting to suggest a rather scary case of deja vu all over again.
4-Step-Deja-Vu…
Chart: Bloomberg
Step 1: Homebuilders rally but physical lumber supply limited sparks boom in futures prices… mills restarted, mal-investment invested, supply surge, demand met…
READ MORE
Please share this article

Atlas Energy Group LLC (NYSE: ATLS)

Atlas Energy Group, LLC, through its subsidiary, Atlas Resource Partners, L.P., develops and produces natural gas, crude oil, and natural gas liquids in the United States. It operates through three segments: ARP, New Atlas, and corporate and other. The company has interests in oil and natural gas properties in the Eagle Ford Shale in South Central Atascosa County, Texas, including 4,000 operated gross acres and net reserves of 12 million barrels of oil equivalent. As of December 31, 2014, it had interests in approximately 600 wells in the Arkoma Basin in eastern Oklahoma with average daily production of 5.1 million cubic feet equivalent. The company is also involved in the terminalling, storage, throughput, and transloading of crude oil and petroleum products in the East Coast, Gulf Coast, and Midwest regions.
Take a look at the 1-year chart of Royal (NYSE: ATLS) with the added notations:
1-year chart of Royal (NYSE: ATLS)
Like most energy related stocks, ATLS fell on hard times starting from the summer of last year. The stock tried to find support at $7.50, but that price eventually gave way to new lows as well. However, on Friday ATLS actually broke back above that prior level of support at $7.50. That break should mean higher prices for the stock in the short-term, at minimum.

The Tale of the Tape: ATLS had a key level of support at $7.50 that it has now broke back above. A trader could enter a long position at $7.50 with a stop placed under the level. If the stock were to break below $7.50 a short position could be entered instead.
Please share this article

Stocks to Watch: MEIP, GERN, LL, TUBE, RUBI

( click to enlarge )

MEI Pharma Inc (NASDAQ:MEIP) is one for the bottom pickers. The price entered within the gap area and a short-term rally is expected. The RSI is bouncing off 30 and the A/D is turnings up showing money is flowing into the stock. At this point, short-term traders may prefer long-positions towards a potential next target around 3.50. A reversal may be on the way.

( click to enlarge )

It looks like Geron Corporation (NASDAQ:GERN) is starting to turn back up and indicators are giving the first bullish signs. I am looking to see this stock re-test its March highs shortly.

( click to enlarge )

Lumber Liquidators Holdings Inc (NYSE:LL) initiated after hours by Cantor Fitzgerald with a $45 target and Buy rating. Nearest resistance for the stock is at 34.05. If this level is crossed and the stock is able to sustain above this level, then it might go to 35.18

( click to enlarge )

TubeMogul Inc (NASDAQ:TUBE) Keep an eye on this one, setting up to break this resistance area. Next buy point 15.95 on volume.

( click to enlarge )

The Rubicon Project Inc (NYSE:RUBI) Momentum has turned bullish and a break above resistance at 18.40 would open the door for a rally to 20.

Please share this article

SUNE SunEdison Bullish Solar Stock Chart For Trendfollowing Traders

Tonight’s stock is a great looking chart that is well suited for trend following traders. The solar stocks as a group are starting to gain some serious traction. That is precisely when you want to take a closer look at the sector. My job as a trader is to seek exposure to the strongest stocks I can find.
The first step is to identify a strong sector like solar. The next step is to look for stocks either trading at an all time high or making new 52 week highs. The goal is to eliminate candidates that might run into trouble due to Overhead Resistance.
SUNE – Sunedison has already taken out immediate overhead resistance and offers almost clear sky potential. Overhead resistance dating back several years typically has much less of an impact on a stock’s future price performance. That said, SUNE is displaying huge pattern pressure and is now starting to develop momentum. Overall the technical picture is very constructive and SUNE is offering one of the most bullish chart set-ups within the solar industry.
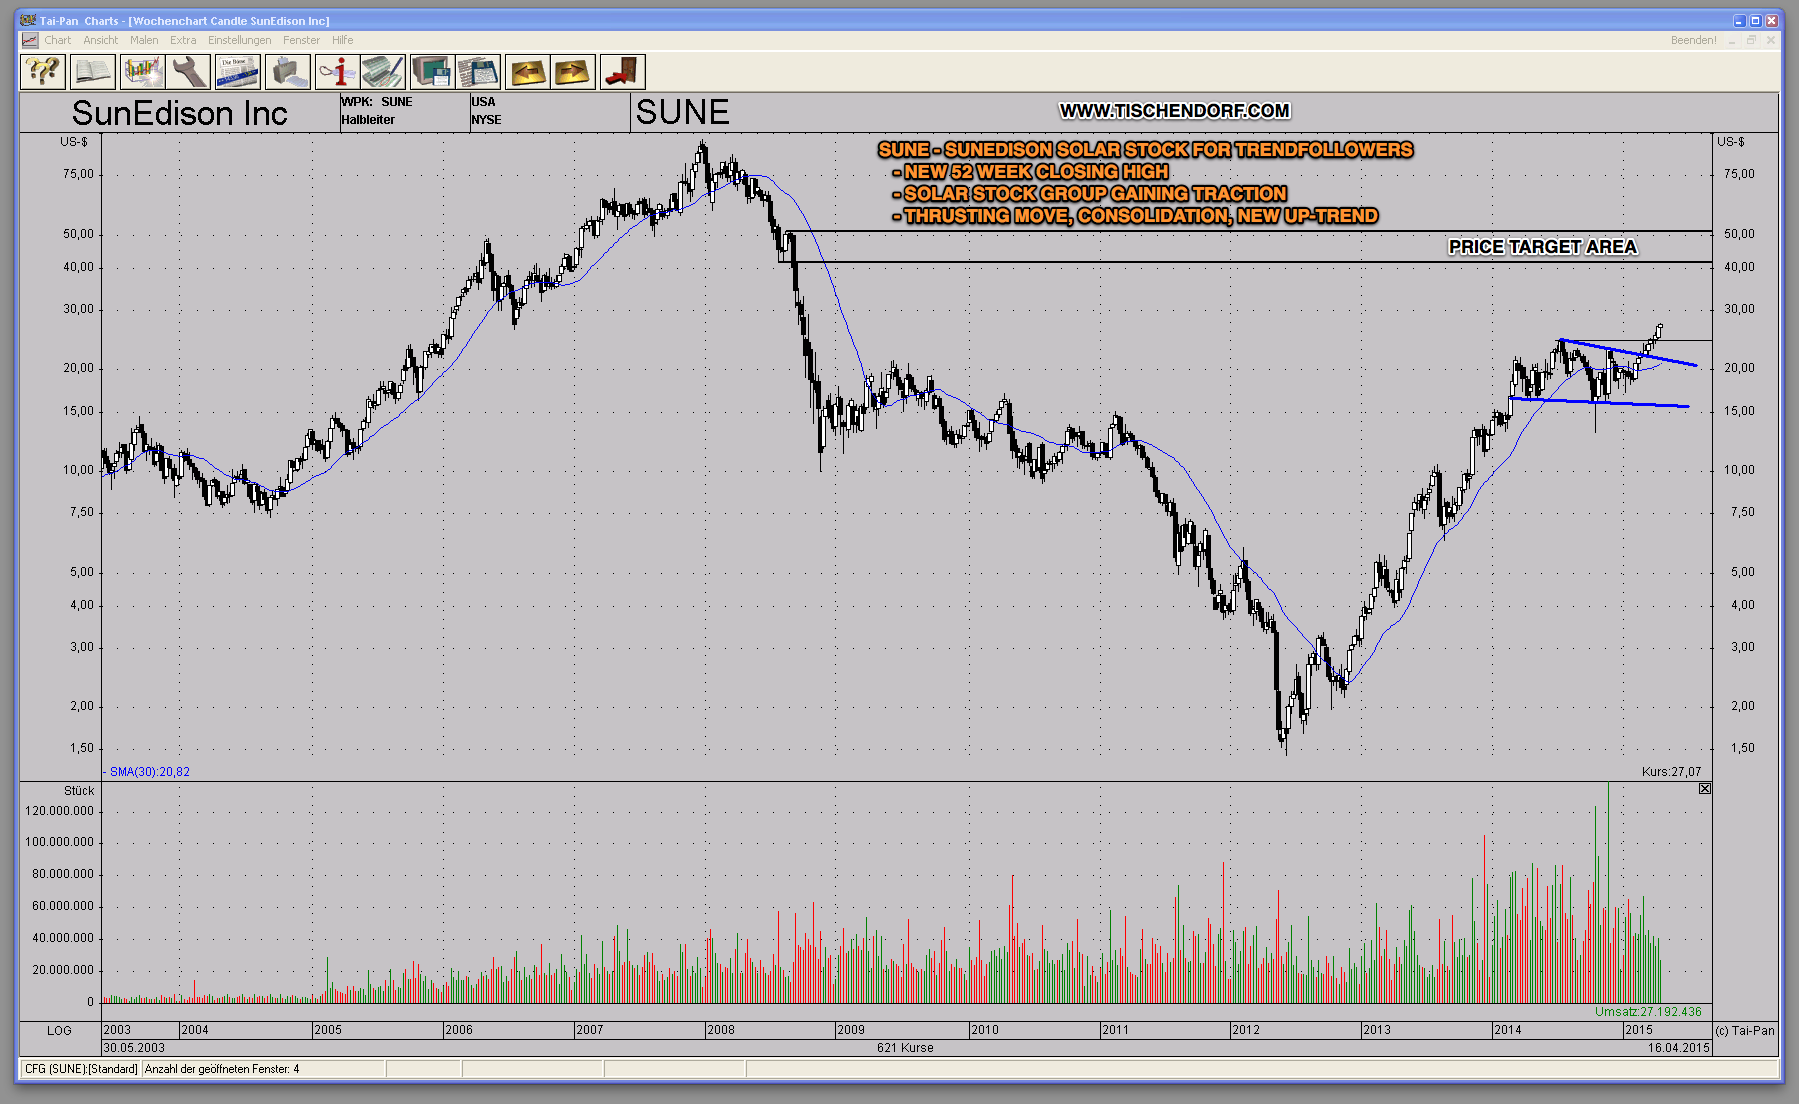
Click on the SUNE – Sunedison chart to enlarge:
SUNE Sunedison - Great Solar Stock For Trendfollowers
The weekly SUNE chart has been trending higher for almost 2 years, the initial thrusting move. Then it consolidated for almost 1 year. Now SUNE has broken out again, printed a new 52 week high and from a purely technical perspective the price target area is the 40 – 50 $ price range drawn into the chart. As you can see I am using past pivot points as the starting point to draw the horizontal trendlines defining the target range channel.
Conclusion: SUNE – Sunedison offers great potential for traders with a trendfollowing mind-set. Ideally the stock should steadily climb higher mimicking the ascent of its initial thrusting move.
- See more at: http://www.tischendorf.com/#sthash.BtK3ioe7.dpuf
Tonight’s stock is a great looking chart that is well suited for trend following traders. The solar stocks as a group are starting to gain some serious traction. That is precisely when you want to take a closer look at the sector. My job as a trader is to seek exposure to the strongest stocks I can find.
The first step is to identify a strong sector like solar. The next step is to look for stocks either trading at an all time high or making new 52 week highs. The goal is to eliminate candidates that might run into trouble due to Overhead Resistance.
SUNE – Sunedison has already taken out immediate overhead resistance and offers almost clear sky potential. Overhead resistance dating back several years typically has much less of an impact on a stock’s future price performance. That said, SUNE is displaying huge pattern pressure and is now starting to develop momentum. Overall the technical picture is very constructive and SUNE is offering one of the most bullish chart set-ups within the solar industry.
The weekly SUNE chart has been trending higher for almost 2 years, the initial thrusting move. Then it consolidated for almost 1 year. Now SUNE has broken out again, printed a new 52 week high and from a purely technical perspective the price target area is the 40 – 50 $ price range drawn into the chart. As you can see I am using past pivot points as the starting point to draw the horizontal trendlines defining the target range channel.
Conclusion: SUNE – Sunedison offers great potential for traders with a trendfollowing mind-set. Ideally the stock should steadily climb higher mimicking the ascent of its initial thrusting move.

Please share this article