Monday, February 7, 2011
Food Prices Aren't Rising…Fiat Currencies Are Collapsing
We have spoken often about what will be the first real domino to fall in causing a chain reaction ending up in massive global political and financial change. Often we follow our predictions with a statement something along the lines of, "but, in actuality, the defining primary event will likely come from somewhere that no one expects".
I think it's safe to say that no one expected TEOTMSAWKI (The End Of The Monetary System As We Know It) would begin in Tunisia!
It appears that people, including Americans and westerners, are willing to put up with all manners of oppression, taxation and economic stagnation until it reaches the point where they are so impoverished that they cannot even afford to eat.
It is, at that point, that they finally fight back against their oppressors as was the case in Tunisia - and which set off a chain reaction of protests and uprisings in Yemen and Egypt along with other related uprisings in Algeria, Lebanon and Jordan.
It is still far too early to begin to make any conclusions about these new developments caused partially by rising food prices in the Arab world but there are three very possible outcomes that all threaten the tenuous US dollar based financial system:
- The worst case scenario: Many of the current governments in the Arab world are overthrown, giving way to the democratically elected devils they didn't know, who delve the entire Middle East into war. This has any number of potential outcomes including nuclear war. It could also drag the US military into hostilities which would further increase the pace of US dollar monetary inflation (needed to pay for further war) which would further hasten the dollar hyperinflation.
- The wave of Arab uprisings moves into Saudi Arabia and the other Middle East/Arab major oil producers causing an overthrow of American friendly governments resulting in an end to the "oil for Treasury bonds" agreement. This could result in the oil region not reinvesting its profits into Treasury bonds causing further weakness in bonds, and prompting the Federal Reserve to contemplate QE3 in order to prevent rates from rising too dramatically, or to the 11.1% mark where the US government may become technically insolvent as interest rates overtake all tax income (minus social security payments).
- Rising food prices and potential for government collapse in other key US Treasury bond holding states such as China, Japan and other Asian countries result in those countries selling Treasury Bonds and dollars in order to increase the value of their currency in order to reduce the prices of imported food items to keep their populations at bay inducing the same results as in (2) above.
The world appears to be going through a purging. A detox, if you will. At no time in world history have people been more regulated, documented, taxed, governed and oppressed. The detoxification may be starting with the planet's poorest who are driven to fight for their rights and freedoms by a system that has impoverished them through inflation, taxation and outright theft to the point where they cannot even afford to eat.
The rising price of food may be the spark that starts things but rising food prices aren't the cause of much of the world's problems, it is only a symptom.

Most mainstream media accounts of rising food prices usually state that the "growing world population" is responsible for the rise in food prices but there is no statistical evidence that growing population correlates to rising food prices. (more)
Stocks Getting Boost From Commercial Real Estate
Prices of commercial properties sold by institutional investors surged 19 percent in 2010, the second-biggest gain on record, according to an index developed by the MIT Center for Real Estate. Investments in office properties, the largest part of the market, more than doubled last year to $41.6 billion, according to Real Capital Analytics Inc., which tracks commercial property sales globally.
We made the case yesterday for a positive outlook for stocks and risk assets based on positive fundamentals and positive technicals. Today's employment report will give us something new to chew on from a fundamental perspective.

Our technical argument from February 3 referenced two market breadth indicators to monitor. It is good news that these have improved this week as of Thurday's close. However as detailed on February 3, "overbought" conditions in these measures of market breadth would give us pause. The charts below show the progress of these indicators on a weekly basis. On a daily chart, we had a mixed bag on Thursday; NYHL was down and NYSI was up.


In the post-employment report market, here are a few things we are monitoring in order to better understand the staying power of the current leg up in stock prices. The S&P 500 has very significant long-term support near 1,200, which means even a big correction would most likely not derail the bull market. See December 15 comments for more detail on the meaning of the chart below. (more)

Technically Precious with Merv
 Gold bottomed and looks to be moving higher BUT the volume is just not there to be
encouraging. The next week or so will tell us if it is going towards higher levels or if the
downside will continue.
Time constraints and no chit chat this week, just the facts.
GOLD
LONG TERM
Well, the P&F advice to wait for the $1320 support to be broken, with a move to $1305, before
going P&F bearish is working, so far. The final support is still holding so we’ll keep our fingers
crossed hoping that now we can go into higher ground. With the turmoil in the Middle East I
would have expected a more exuberant gold move but it does what it has to do to confuse
most traders.
My normal indicators are still giving us a positive reading. Gold bounced off its long term
moving average line and remains above the line. The moving average line itself is still in a
positive trend. The long term momentum remains in its positive zone although it has decline
quite a bit from its high and remains just a hair below its negative sloping trigger line. The
volume indicator continues to drift sideways and is sitting right on top of its still slightly positive
trigger line. All in all the long term rating remains BULLISH.
INTERMEDIATE TERM
Unfortunately the intermediate term is not as positive as was the long term. Gold is still below
its negative sloping moving average line. The momentum indicator is, however, in its positive
zone (just slightly) and above a positive trigger line. The volume indicator is zigzagging above
and below its trigger line ending the week just below the line with the line continuing in a
negative direction. Putting all this together we are neither bullish nor bearish but are at a –
NEUTRAL rating for the intermediate term. The short term moving average line is still some
distance below the intermediate term line and not yet ready to confirm any upgrade in rating.
SHORT TERM
One might be encouraged by the actions of gold to stage somewhat of a bottoming and rally
event but I’m not yet fully convinced that the turn around is here. The biggest worry is the lack
of upside volume action. Bull moves rarely last without the backing of increasing upside
volume action. As we see in the chart the recent volume is below is average volume from the
past 15 days, which included a good portion of the downside trend. But let’s look at the
indicators and see if they might give us a more encouraging assessment. (more)
Time for Caution on Commodities
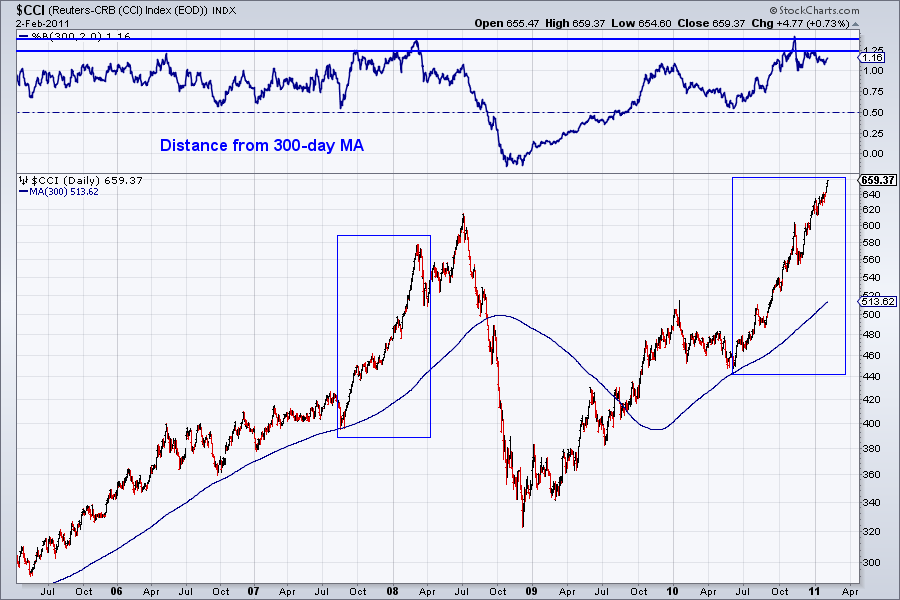
Commodities are a very volatile asset class and unlike stocks, high prices will reduce demand while low prices will reduce production and supply. While buying breakouts and momentum in stocks often works well with the right risk controls, buying weakness rather than strength is more advisable in Commodities.
The continuous commodity index (CCI) recently hit an all-time high and has continued to make new highs. The energy and agriculture sectors have been red-hot. Two things concern us in regards to the CCI. First, the market has had a single 8% pullback in the last eight months. Other than that, no weakness for more than a few days at a time. Second, the market is trading well above the 300-day MA. At the top of the chart we show the market’s distance from its 300-day MA.
Also, quite a bit of retail money has suddenly flowed into commodity-related shares. The chart below (from sentimentrader.com) shows the assets in Rydex’ Energy Fund. About two months ago, assets in the fund were less than $50 Million. Now, the total is $152 Million.
We see similar action in Rydex’ Materials Fund. Assets in the fund have tripled in the last six months.
The only aberration is the precious metals sector. We don’t show the chart but assets in that fund declined about 50% since the end of December. Moreover, we recently wrote about how the speculative money in the futures market remains heavily long all commodities (ex Gold & Silver).
We are in a long-term bull market and we believe commodities as an asset class will heat up in the coming years. That being said, commodities are very overbought here and the risk/reward for new longs is unfavorable. We see an intermediate top in the coming weeks or months. We’d advise lightening up on long positions and perhaps using stops to protect profits. This is a volatile asset class and if you exercise patience and use volatility to your advantage, you will likely find a few excellent long opportunities per year. This is not one of the times.
Speculative Bullish Rice Bets Surge To Year Highs As Dollar Sentiment Plumbs New Lows
As we have highlighted over the past week, one of the best performing asset classes in trecent days has been rice. And judging by the just released CFTC Commitment of Trader data, the speculators are waking up to the possibility that rice has along way to go higher. The Non-Commercial Net Speculative positions in Rough Rice (per CBOT), have jumped to 5,811 in the week ending February 1, and are now the highest they have been in over a year. They are also double where they were less than 4 weeks ago. Of course, with increasingly more popular speculative positions, the concern that profit taking rallies will appear should be widely anticipated. We expect at least one-two broad selloffs in rice in the coming days, following which distribution the path for continued moves higher in the grain should be wide open.

Other CFTC data indicated that bullish sentiment in other grain and soft food commodities continues to rise:

In Treasurys, specs continue to expect aggressive steepening in the 2s10s region, as both 2 and 5 year net non-commercial contracts have jumped to near-highs, while the 10 Year specs continue selling off, and as now back to August levels.

Lastly, and possibly most importantly, net long bets in the US Dollar just hit another multi year low, just as both the EUR and GBP appear poised to take out prior mega-bullish positions. We continue to expect this trend to revert and major profit taking in the EUR complex, coupled with a short-covering technical push in the USD, to bring the EURUSD much lower (all this completely independent of fundamentals which keep getting worse for all currencies involved).

US Economic Calendar for the Week
| Date | Time (ET) | Statistic | For | Actual | Briefing Forecast | Market Expects | Prior | Revised From |
| Feb 7 | 3:00 PM | Consumer Credit | Dec | - | $2.5B | $2.5B | $1.3B | - |
| Feb 9 | 7:00 AM | MBA Mortgage Purchase Index | 02/04 | - | NA | NA | 11.3% | - |
| Feb 9 | 10:30 AM | Crude Inventories | 02/05 | - | NA | NA | 2.59M | - |
| Feb 10 | 8:30 AM | Initial Claims | 02/05 | - | 410K | 413K | 415K | - |
| Feb 10 | 8:30 AM | Continuing Claims | 01/29 | - | 3900K | 3900K | 3925K | - |
| Feb 10 | 10:00 AM | Wholesale Inventories | Dec | - | 1.5% | 0.7% | -0.2% | - |
| Feb 10 | 2:00 PM | Treasury Budget | Jan | - | NA | -$50.0B | -42.6B | - |
| Feb 11 | 8:30 AM | Trade Balance | Dec | - | -$42.0B | -$40.7B | -$38.3B | - |
| Feb 11 | 9:55 AM | Mich Sentiment | Feb | - | 75.5 | 75.5 | 74.2 | - |