Tuesday, December 9, 2014

Charting the Strongest and Weakest Sectors XLF and XLE

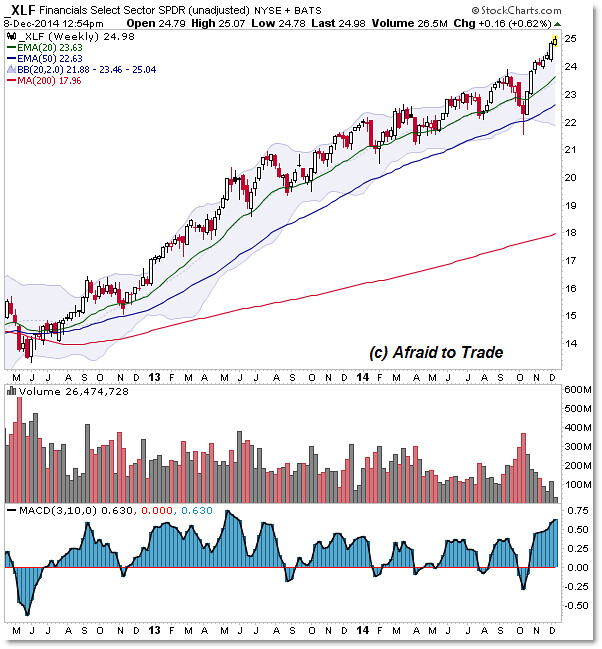
A longer-term comparison reveals the current strongest sectors and weakest sector for trade and position planning.
Let’s see these weekly charts and highlight key levels to watch for additional opportunities:

Depending on how you measure relative strength, you’ll find that the Financial (XLF), Technology (XLK), Staples (XLP), and Health Care (XLV) sectors all show steady uptrends with price impulsing to new highs. (more)

Please share this article

America: The best place to invest your money

If you slept through the past five years, you missed a helluva ride for the American stock market.
Not only did U.S. equities trounce their depressing performance from last decade, but they left all other major markets in the dust.
Since the end of 2009, the S&P 500 has generated annualized total returns (including dividends) of about 16%. That's a very impressive average based on historical standards.
It's also very strong considering most major stock markets produced modest annual returns in the mid-to-high single digits. Some, like former stock market darlings China and Brazil, suffered outright annual declines.  (more)

Please share this article

Molson Coors Brewing Company (NYSE: TAP)

Molson Coors Brewing Company manufactures and sells beer and other beverage products. The company sells its products in Canada under the Coors Light, Molson Canadian, Molson Export, Molson Canadian 67, Molson Dry, Molson Canadian Cider, the Rickard’s family, Carling, Carling Black Label, Pilsner, Keystone Light, Creemore Springs, the Granville Island, and Coors Banquet brands. It also brews or distributes licensed products under the Heineken, Amstel Light, Murphy’s, Newcastle Brown Ale, Strongbow cider, Miller Lite, Miller Genuine Draft, Miller Chill, Milwaukee’s Best, and Milwaukee’s Best Dry brands. In addition, the company distributes the Corona, Coronita, Negra Modelo, and Pacifico brands, as well as Singha brand.
Take a look at the 1-year chart of Molson (NYSE: TAP) below with added notations:
1-year chart of Molson (NYSE: TAP)
TAP rallied from February into September before finally stalling at $77.50. The stock reached that $77.50 mark again several times in November only to pull back down. If TAP can retest the $75.50 level once more (purple) the stock may finally look to break through. A close above that resistance would also constitute a new 52-week high.

The Tale of the Tape: TAP has a 52-week resistance at $77.50. The possible long position on the stock would be on a breakout above that level with a stop placed under it.
Please share this article
This Week in Money with Guests: Ross Clark, David Gurwitz, Darrin Hopkins


Please share this article

BNN Top Picks from Jeff Young: WPT Industrial REIT WIT.TO, Keyera KEY.TO, and Gildan Activewear GIL.TO

Jeff Young, co-chief executive officer and chief investment officer, NexGen Financial

Focus: Canadian Dividend stocks
MARKET OUTLOOK:
The Canadian equity markets remain somewhat challenged by the recent fall in oil prices and general weakness in other commodities. With so much of the index related to resources, the S&P/TSX composite is once again trailing U.S. markets which are benefitting from improving U.S. economic growth. Within the Canadian market place non-resource related stocks have performed considerably better than those with even indirect exposure to oil and gas or other resources. While we expect this theme could continue for some time, the defensive segment of the Canadian market continues to appear expensive relative to the market overall. Ultimately this valuation disparity will provide opportunities in more resource related companies however the path to their eventual outperformance is unlikely to be a smooth one. (more)

Please share this article