
Friday, November 29, 2019

Wednesday, November 27, 2019

Tuesday, November 26, 2019


Monday, November 25, 2019


Friday, November 22, 2019


Thursday, November 21, 2019


QE vs Managing Benchmark Rates
QUESTION: The
Fed buying $60 billion in T-Bills each month is obviously not long-term
QE. They are expanding their balance sheet, but this is clearly not the
QE as before. As a professional institution we can see the difference.
Would you elaborate on the difference? FH
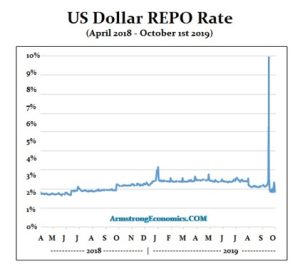
ANSWER: The Fed is buying $60 billion of Treasury bills per month for an entirely different purpose. They are trying to prevent short-term rates from rising. The 2007-2009 QE was an attempt to “stimulate” the economy by encouraging banks to lend, which it failed to accomplish. Here the Fed is trying to prevent repo rates from rising to 10% again because the banks do not trust banks.
We are witnessing the Fed trying to maintain control over the benchmark short-term interest rate it uses to guide monetary policy. They are NOT “stimulating” the economy, bailing out banks, buying US debt because others will not, or anything of the like. Buying T-Bills is short-term not long-term. They are trying to artificially prevent short-term rates from rising which our model shows in underway.
The crisis has NOTHING to do with the economy domestically and it is not Quantitative Easing trying to stimulate the economy by buying in long-term debt. They are trying to keep short-term rates from rising which is being instigated by an entirely different type of financial crisis that has NEVER before been witnessed.
I cannot go into elaborate detail on this blog. I do not want to be accused of starting a financial panic for the way things always work is they need someone to blame. I get calls from those involved so anything I would report would not be opinion or speculation. Hence, I must respect what is unfolding and it has to be in a report or at a conference, not on this blog where we do not restrict who comes in or out.
https://www.armstrongeconomics.com/markets-by-sector/interest-rates/qe-v-managing-benchmark-rates/
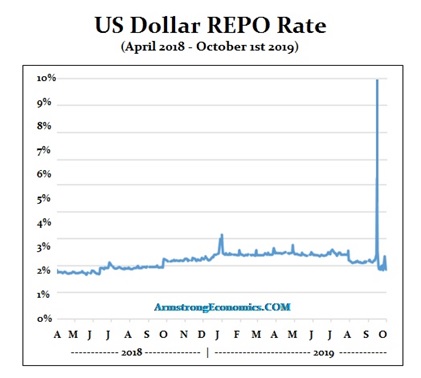
Wednesday, November 20, 2019

Tuesday, November 19, 2019


Talk about record gold outflow this month and what it means
If you want to earn 34%-50% a year return on your trading account with very few ETF trades then join me at the Wealth Building Newsletter today! (read more here)
Monday, November 18, 2019
VIX Volatility Warns Of Imminent Stock Market Correction

The VIX is warning that a market peak may be setting up in the global markets and that investors should be cautious of the extremely low price in the VIX. These extremely low prices in the VIX are typically followed by some type of increased volatility in the markets.
The US Federal Reserve continues to push an easy money policy and has recently begun acquiring more dept allowing a deeper move towards a Quantitative Easing stance. This move, along with investor confidence in the US markets, has prompted early warning signs that the market has reached near extreme levels/peaks. (read more here)


The Next Energy, Gold, and Stock Index Trade Setups

Chris Vermeulen, Founder of The Technical Traders joins me to discuss the shift over the past few months away from the safe-haven assets and into the more risk on equity markets. He points to the record outflows in some of the gold ETFs as a sign that the selling could finally be getting exhausted. We wrap the interview with a comment on the oil price.
(read more here)
Saturday, November 16, 2019
Oil Set To Collapse to $40 - Part I & II

Currently, commodity prices are the cheapest they’ve been in over 40 years compared to equity prices. US Equities have continued to rise over the past 7+ years due to a number of external processes. QE1, 2, 3, and Fed Debt Purchases Share Buy-Backs and creative credit facilities. Only recently have investors really started to pile into the US stock market (see charts below). Global investors were very cautious throughout the rally from 2011 to 2016. In fact, the amount of capital invested within the US money market accounts was relatively flat throughout that entire time.
It was only after the 2016 US presidential election that investors really began to have confidence in the global economy and started piling into the US stock market and money market accounts. This was also after the time that Oil began to collapse (2014~16) as well as the deflation of Emerging Markets rallies. With all this new money having entered the global markets and equities being extremely overbought currently, what would happen is Oil collapsed below $40 and the global economic outlook soured headed into the 2020 US presidential election? (read more here)
Read Part II here
How to Trade Gold, Oil and Bonds with Cycles

We have been using cycles since 2011 and have developed multiple proprietary price modeling tools over the past 5+ years that assist us in finding and timing great trades. Most of what we have learned over the past 8+ years is refined into “experience and skill”. When you follow the markets every day – every hour, for the past 8+ years and see various types of price and technical indicator setups and reactions, you learn to hone into certain setups that have proven to be highly accurate trading triggers.
Our research team had dedicated thousands of hours to develop the tremendous skills and experience to be able to produce accurate cycles, and to also interpret them, which is what we specialize in doing. Determining which cycles to trade may look simple, yet they are far from easy to trade without the setups and price rotation signals. (read more here)
Friday, November 15, 2019


Thursday, November 14, 2019


Wednesday, November 13, 2019

Tuesday, November 12, 2019

Monday, November 11, 2019

Friday, November 8, 2019


Thursday, November 7, 2019


Wednesday, November 6, 2019


Tuesday, November 5, 2019


Monday, November 4, 2019


Friday, November 1, 2019

Subscribe to:
Posts (Atom)