Tuesday, March 18, 2014

Monster Silver Rally Brewing

On silver’s 1-year chart we can see that a fine large Double Bottom is completing. We already had the breakout on good volume from the 2nd trough of this Double Bottom in the middle of February, and it was this event that has (rightly) caused traders to pile into silver, although the price hasn’t moved much – yet. The better silver stocks, on the other hand, are already on fire, because the “writing is on the wall”. Right now the price is consolidating following the breakout in a fine tight Flag formation, from which upside breakout looks imminent.
Silver $21.46
How far is next major uptrend in silver likely to carry? – to figure that out we turn now to the long-term 14-year chart, which shows silver’s entire bullmarket to date.  (more)Please share this article

Jim Sinclair: Russia Can Collapse US Economy, Gold Update, Silver is Gold on Steroids & More


Please share this article

Natural Gas is a Buy Again Right Here

This has been one of my favorites for a long time. We’ve had this $6.40 target for a while now and backed off once that was reached. Since this epic sell-off back to support, prices have consolidated nicely above last year’s key resistance levels.
Here is a daily chart where we can see prices selling off during February to get back down to the highs from last April and December. Our polarity principles suggest that this former resistance should turn into support, which is exactly what we’re seeing here:
3-17-2014 NG AC

What I like most is the overshoot of this support after the inventory report last Thursday. We saw a 2-week consolidation from the end of February through mid-March. Prices initially reacted negatively to the news event Thursday morning but then quickly recovered on Friday and followed through nicely Monday morning.  (more)
Please share this article

Canadian Solar Inc. (NASDAQ: CSIQ)

Canadian Solar Inc. engages in the design, development, manufacture, and sale of solar power products worldwide. The company offers solar wafers, cells, and solar module products that convert sunlight into electricity for various uses. Its products include a range of standard solar modules for use in a range of residential, commercial, and industrial solar power generation systems. The company also designs and produces specialty solar modules and products consisting of customized solar modules that its customers incorporate into their products, such as building integrated photovoltaic modules, or BIPV modules; and specialty products, such as portable solar home systems and solar-powered car battery chargers. In addition, it sells solar system kits, a package consisting of solar modules produced by it; and third party supplied components, such as inverters, racking system, and other accessories.
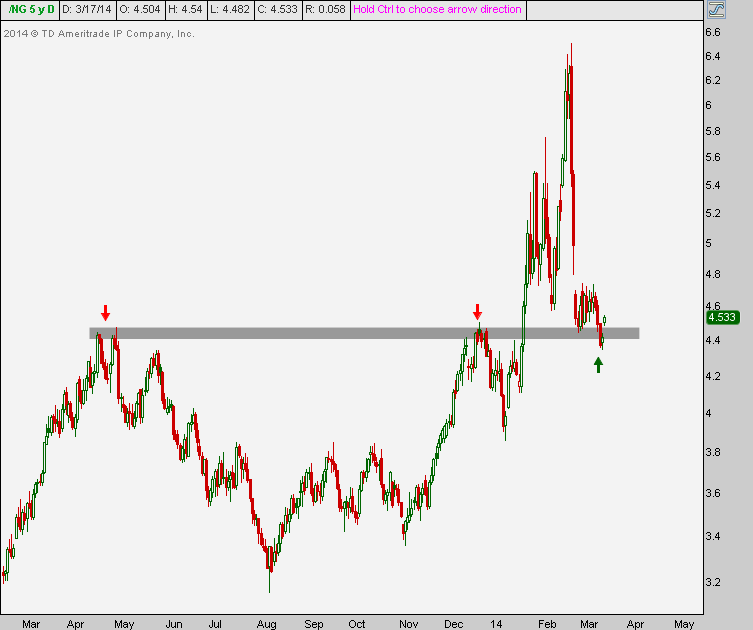
To review potential trading opportunities with Canadian’s stock, please take a look at the 1-year chart of CSIQ (Canadian Solar, Inc.) below with my added notations:
1-year chart of CSIQ (Canadian Solar, Inc.)
Double tops are reversal patterns and are as simple as they sound: Rallying up to a point (T), selling off to a support, and then rallying back up again to approximately the same top (T). CSIQ appears to have formed a double top price pattern (red) from the beginning of the year until earlier this week. As with any price pattern, a confirmation of the pattern is needed. CSIQ confirmed its pattern by breaking the $35 support (blue) that was created by the double top pattern.

The Tale of the Tape: CSIQ has broken down from its double top and should be moving lower overall. A short trade could be made on any rallies back up to $35, while a long trade could be made if the stock were to break back above the $35 level.
Please share this article

We’re Headed for a Golden Cross


news.goldseek.com / By Frank Holmes / 17 March 2014
Every week, our investment team reviews a variety of sources to formulate a summary of the top events in the gold, resources, and emerging markets. The results are categorized in terms of strengths, weaknesses, opportunities and threats. We believe this SWOT model helps investors make informed decisions about their gold and gold stock investments.
For the week beginning March 10, here is the SWOT for the gold market.
READ MORE
Please share this article

U.S. Dollar Forecast

gold-eagle.com  / By Vronsky / March 17, 2014
The US Dollar Index is on the verge of substantially rising in value during the next couple of years. There are a number of reasons for this prediction. Firstly, the US$ is grossly over-sold (ie under-valued). Since 2001 the greenback has lost more than one-third of its value, falling from 120 to 80.
READ MORE
Please share this article