Wednesday, April 30, 2014

Risk of 20% Stock Correction Highest Until October: B. of A.’s Suttmeier

by Wallace Witkowski
Market Watch

It’s becoming a drumbeat of investors wary of the big downturn: Traditional “Sell in May” weakness coupled with the midterm year of a presidential cycle makes the market fertile ground for a correction.
After all, stocks are creeping back up toward record highs during a historically vulnerable time for the market.
The latest comes from Stephen Suttmeier, technical research analyst at Bank of America Merrill Lynch, who points out there’s a more than 23% chance of the broader stock market shedding a fifth of its value sometime before October. Suttmeier notes:
Continue Reading at MarketWatch.com…
Please share this article

4 Penny Stocks for 2014: ELON, DVAX, IDIX

Penny stock investing is so attractive to investors because these small-cap stocks can bring huge gains in a short period of time.
Whether these small-cap companies are industry leaders in a burgeoning market, are primed for a takeover, or are developing new pharmaceutical patents, the best penny stocks of 2014 offer investors huge profit potential at affordable prices.
While there are often wild price fluctuations associated with penny stocks, investors on the right side of price swings can bank huge gains.  (more)

Please share this article

Case-Shiller Has Longest Home Price Decline Stretch Since 2012; 13 Of 20 Cities See Price Drops

zerohedge.com / by Tyler Durden / 04/29/2014 09:22 -0400
What a difference Seasonally adjusted and Unadjusted data makes: for the best example look no further than the just released latest Case Shiller index, where the Seasonally Adjusted 20 City Composite Index grew by a less than expected 0.76% (Exp. 0.80%), down from the 0.80% last month, and the Year over Year price also missed expectations of a 13.00% increase, printing slightly less at 12.86%. However, while the well-delayed February data was a modest miss across the board, more importantly it represented that there has been price increases for 24 consecutive months. One gets a very different story if one looks at the NSA data, where Y/Y prices increased the same, or 12.86%, however on a sequential basis, prices have now declined for 4 months in a row – the longest negative stretch in actual home prices since March 2012.
What’s worse, even Case Shiller itself appears to have given up on housing as the driver of the wealth effect: “Five years into the recovery from the recession, the economy will need to look to gains in consumer  spending and business investment more than housing. Long overdue activity in residential  construction would be welcome, but is certainly not assured.”
Please share this article

FireEye, Inc (NASDAQ: FEYE)

FireEye, Inc. provides products and services for detecting, preventing, and resolving advanced cybersecurity threats. Its products comprise threat prevention system that provides threat protection from network to endpoint for inbound and outbound network traffic, such as Web threat prevention appliances to analyze all Web traffic; email threat prevention appliances that detect and stop advanced attacks; and file threat prevention appliances, which analyze network file servers to detect and quarantine malicious software. The company’s products also include central management appliances that manage threat prevention system; forensic analysis system, which executes and inspects malware, zero-day, and other advanced cyber attacks; and endpoint threat prevention systems that detect, analyze, and resolve security incidents.
To review FireEye’s stock, please take a look at the 7-month chart of FEYE (FireEye, Inc.) below with my added notations:
FEYE

The Tale of the Tape: FEYE has broken its key level of support at $45. A short trade could be made on any rallies up to that $45 area with a stop placed above that level. A break back above $45 would negate the forecast for a lower move.
Please share this article

Time to Act: Pension Funds are Drying Up

by Peter Krauth, Resource Specialist
Money Morning


On numerous occasions, I’ve told you to remain on lookout for threats to your savings, including the proposed new MyRA account.
If you’ve been counting on your pension, whether from work or even Social Security, you may want to revise those plans, as most are way underfunded.
Research by Bridgewater Associates, the world’s largest hedge fund, estimates that 85% of public pensions could go bust within 30 years.
Public pension funds currently have about $3 trillion in assets, but will need to pay out nearly $10 trillion over the next several decades.
Continue Reading at MoneyMorning.com…
Please share this article

Tuesday, April 29, 2014

Marc Faber: “Emerging Economies Will Be Submerging Soon; May Lead To Devaluations & Higher Gold Demand”

During a time of stagnating emerging market growth and increasing Asian gold demand, Marc Faber, Director of Sprott Inc. and Publisher of TheGloom, Boom and Doom Reportwas kind enough to share a few comments.
According to Marc, “if the Chinese economy imploded, it is likely that…the government would implement a devaluation of the yuan,” leading to similar currency moves in the region.
Here are his full interview comments with Sprott Global Resource Investment Ltd.’s Tekoa Da Silva:
TD: Marc, the narrative on natural resources involves Asian demand. You live in Asia. So what’s happening on the ground there and can we rely on continued growth in the region?
MF: Well, that’s a very good question because we have an economic slowdown in emerging economies that is very pronounced and I think some emerging economies may be submerging soon, and have actually significant economic problems. Then the question arises, “Will they continue to buy gold?” Say if there was a recession in China, in the downturn, would people buy gold?

READ MORE

Please share this article

Who Killed Facebook? FB

from Wealth Cycles

Despite evidence to the contrary—such as 1.28 billion monthly users and a $1.84 billion market valuation as of March 13—online social network Facebook is dying, according to a paper by two Princeton academics published in January. The Princeton study predicts that Facebook will lose 80% of its peak users by 2017. The Princeton results reaffirm an earlier global social media impact study funded by the European Union, which reveals that the key youth demographic so attractive to marketers and so essential to the future of any online platform is abandoning Facebook in droves, according to a 2013 Bloomberg Television report.
Continue Reading at WealthCycles.com…
Please share this article

Nationstar Mortgage Holdings Inc (NYSE: NSM)

Nationstar Mortgage Holdings Inc. provides residential mortgage loan services in the United States. The company operates in two segments, Servicing and Originations. The Servicing segment is involved in the calculation, collection, and remittance of principal and interest payments; administration of mortgage escrow accounts; collection of insurance claims; administration of foreclosure procedures; management of real estate owned (REO); and disbursement of required protective advances. The Originations segment is involved in the origination, packaging, and sale of government-sponsored enterprises mortgage loans into the secondary markets. It also provides a servicing portfolio retention source by providing refinancing services to its existing servicing customers; an organic source of servicing assets; and a loss mitigation solution for its servicing clients and customers by offering refinancing options to borrowers allowing them to lower their monthly.
To review Nationstar’s stock, please take a look at the 1-year chart of NSM (Nationstar Mortgage, Inc.) below with my added notations:
1-year chart of NSM (Nationstar Mortgage, Inc.)
NSM has fallen pretty hard since its $58 peak in September. The stock finally bottomed around $25 in February and has now recovered a bit. The previous $35 support is not acting as resistance for the stock (red). The $30 level, which has been prior resistance, is now acting as support. Eventually, one of these two levels will have to give.

The Tale of the Tape: NSM is trading between its $30 and $35 levels. A long trade could be made on a pullback to $30 or on a break above $35 with a stop loss placed under the level of entry. Short setups would occur if the stock rallied back to $35 or broke below $30.
Please share this article

Russian Relief Rally As US Sanctions List “Better Than Expected”

zerohedge.com / by Tyler Durden /
While Jay Carney and the White House continue to press their “sell” recommendation on Russian assets, it appears the market is buying the news (after selling the rumor). Russian stocks are ripping higher on “better than expected” sanctions and the Ruble is strengthening notably… So given that the market is signaling these sanctions are clearly weaker than expected,  we should certainly not expect any Russia de-escalation soon.
Russian Stocks soaring…
READ MORE
Please share this article

Deutsche Bank’s $75 Trillion In Derivatives Is 20 Times Greater Than German GDP


It is perhaps supremely ironic that the last time we did an in depth analysis of Deutsche Bank’s financial situation was precisely a year ago, when the largest bank in Europe (and according to some, the world), stunned its investors with a 10% equity dilution. Why the capital raise if everything was as peachy as the ECB promised it had been? It turned out, nothing was peachy, and in fact DB would proceed to undergo a massive balance sheet deleveraging campaign over the next year, in which it would quietly dispose of all the ugly stuff on its balance sheet during the relentless Fed and BOJ-inspired “dash for trash” rally in a way not to spook investors about everything else that may be beneath the Deutsche covers.
We note this because moments ago, Deutsche Bank did the same again when it announced that it would issue yet another €1.5 billion in Tier 1 capital.
The issuance will be the third step in a co-ordinated series of measures, announced on 29 April 2013, to further strengthen the Bank’s capital structure and follows a EUR 3 billion equity capital raise in April 2013 and the issuance of USD 1.5 billion CRD4 compliant Tier 2 securities in May 2013. Today’s announced transaction is the first step towards reaching the overall targeted volume of approximately EUR 5 billion of CRD4 compliant Additional Tier 1 capital which the Bank plans to issue by the end of 2015
READ MORE
Please share this article

Monday, April 28, 2014

Time To Buy Energy?


Please share this article

The Canadian Housing Bubble Puts Even The US To Shame

Since the bursting of the first US housing bubble in 2007, one of the primary explicit goals of the Fed has been to reflate the very same housing bubble (whose pop, together with the credit bubble, nearly wiped out the western financial system) as housing, far more than stocks, is instrumental to the "wealth effect" of the broader population (as opposed to just the 1%).
Sadly for the Fed, instead of recovering previous highs, median housing prices (not to be confused with the ultraluxury high end where prices have never been higher) have stagnated and are now in the downward phase of the fourth consecutive dead cat bounce, curiously matching a like amount of Fed monetary injection episodes.
But while the Fed has clearly had a problem with reflating the broader housing bubble, one which would impact the middle class instead of just those who are already wealthier than ever before thanks to the Russel 200,000, one place which not only never suffered a housing bubble pop in the 2006-2008 years, but never looked back as it continued its diagonal 'bottom left to top right' trajectory is Canada. As the chart below shows, the Canadian housing bubble has put all attempts at listening to Krugman and reflating yet another bubble to shame.

Here is the Globe and Mail's take:
The gap between the average price of a home in Canada and the United States widened to a record level in the first quarter of this year, contrary to what economists would have expected, according to Bank of Montreal’s chief economist Doug Porter.

Average Canadian home prices were 66 per cent above average U.S. prices during the first three months of this year, he says. (Note: these are prices for existing houses and condos, not those that are newly constructed).

“The main takeaway is that, contrary to all expectations, the Canadian housing market has just kept on rolling in 2014 even as the U.S. housing market has  paused for breath (after a steep climb out of the dungeon),” he writes in a research note. “Put it this way, how many pundits a year ago were calling for Canadian home prices to rise faster than their U.S. counterparts in any single measure?”

It's worth noting that there are many problems with comparing average Canadian home prices to average U.S. home prices, not the least of which is that average prices themselves can be highly misleading. Mr. Porter is aware that it’s not an apples-to-apples comparison.

“Some may quibble that this doesn’t take the exchange rate into account, but even adjusting for the Canadian dollar leaves a 50 per cent price gap,” he writes.
So if indeed the Fed is intent on reflating the housing bubble for all, not just for some, perhaps it is time to take a look at what the northern neighbor is doing and do the same.  Of course, the question remains how much more "up and to the right" movement is left in Canadian home prices, where the Chinese and Russian oligarch bid is, according to some, an even greater factor in setting marginal prices than in the US and Hong Kong.
Please share this article

This Week in Money with Guests: Marin Katusa, Eric Coffin, Richard Knowles – April 26, 2014


Please share this article

Chart of the Day - Clayton Williams Energy (CWEI)

The Chart of the Day is Clayton Williams Energy (CWEI). I found the stock by sorting the New High List for new high frequency in the last month then reviewed the charts using the Flipchart feature. Since the Trend Spotter signaled a buy on 2/5 the stock is up 70.72%.

CWEI is an independent oil and gas company engaged in the exploration for and development and production of oil and natural gas primarily in Texas, Louisiana and New Mexico. A significant portion of the company's proved oil and gas reserves are concentrated in the Cretaceous Trend, which extends from south Texas through east Texas, Louisiana and other southern states and includes the Austin Chalk, Buda, and Georgetown formations.

Please share this article

Vuzix Corporation (OTC: VUZI) Tiny Tech Firm's Smart Glass Success These Beat the Google Glass

According to a 2012 study conducted by IHS, wearable technologies will account for more than $6 billion in sales in the year 2016.
The world market for such things as smartwatches, health-monitoring bracelets, smart clothing, and whatever else the geniuses in the R&D departments of today's tech leaders come up with is expected to hit an estimated 171 million devices — a greater than 10-fold increase from the 14 million figure cited at the time of the study.
Global Wearable Tech Shipments ForecastOf those 171 million devices, a vast majority will be privately-owned gadgets worn outside of a work setting for doing things like taking photos, sending and receiving messages, engaging with social networks, and the rest of the functions you generally expect from your current smartphone.  (more)
Please share this article

US Weekly Economic Calendar

time (et) report period Actual forecast previous
MONDAY, APRIL 28
10 am Pending home sales March   -- -0.8%
Tuesday, APRIL 29
9 am Case-Shiller home prices Feb.   -- 13.2% y-o-y
10 am Consumer confidence index April   83.2 82.3
10 am Rental vacancy rate Q1   -- 8.2%
WEDNESDAY, APRIL 30
8:15 am ADP employment April   -- 191,000
8:30 am GDP 1Q   1.0% 2.6%
8:30 am Employment cost index 1Q   0.5% 0.5%
9;45 am Chicago PMI April   56.1 55.9
2 pm FOMC statement        
Thursday, May 1
8:30 am Jobless claims 4/26   322,000  329,000
8:30 am Personal income March   0.4% 0.3%
8:30 am Consumer spending March   0.6% 0.3%
9:45 am Markit PMI April   -- N/A
10 am ISM April   54.4% 53.7%
10 am Construction spending March   0.5% 0.1%
TBA Motor vehicle sales April   16.3 mln 16.3 mln
FRIDAY, MAY 2
8:30 am Nonfarm payrolls April   218,000 192,000
8:30 am Unemployment rate April   6.6% 6.7%
10 am Factory orders March   1.3% 1.6%
Please share this article

Saturday, April 26, 2014

Felix Zulauf – The World Monetary System Is Going To Collapse

kingworldnews.com / April 25, 2014
Today renowned money manager Felix Zulauf warned King World News that the world monetary system is going to collapse.  Zulauf, founder of Zulauf Asset Management and 20+ year Barron’s Roundtable panelist, also discussed how all of this will impact major markets, including gold.  Below is what Zulauf had to say in the first of a series of powerful written interviews that will be released on King World News.
Eric King:  Will the key (to surviving) this (end game), as you warned many, many years ago, be to be outside the banking system?”
Zulauf:  “Absolutely.  The banks are the worst money managers of this world.  I don’t blame them because they are the receivers and transmission mechanism for all the money being printed by the central banks.  They are flooded with cheap or gratis money.  They have to do something with that money, so they go into carry trades.  You can look back in history.  It started with Citicorp being trapped in Mexico.  It goes on and on and on, and they are in carry trades again.
And when you look at the quality spreads between junk bonds and Treasuries, we are back to the extremes of 2007, at the last cycle peak….
READ MORE
Please share this article

THINK $1 MILLION IS ENOUGH FOR RETIREMENT? YOU’RE WRONG.

A million dollars…
Wow, seems like a lot of money doesn’t it?
Everybody would love to become a millionaire, retire without a worry and spend the rest of your days on earth having fun….
There’s just one major problem: $1 million dollars is the new middle-class. Do you have it in an IRA? Well, the government might be interested in confiscated it. In a domestic bank account? Well, legislation has been written legalizing a possible future bail-in. Some of the retirement money sitting in your account could be shaven drastically. That’s what has happened in Cyprus. How about a devaluation? That’s what the people of Ukraine are suffering through as I write.
In 1953 the movie “How to Marry a Millionaire” was out in theaters. $1 million back then bought the equivalent of $8.7 million today (based on manipulated government numbers, which means it actually buys much less). $1 million won’t even buy an average apartment in Manhattan today!
Why isn’t $1 million worth that much anymore? Inflation. The Federal Reserve is printing billions of dollars every single month! Ultra low interest rates in bond markets have also contributed.
Unfortunately for US citizens, they will be the victims of a crisis which is only going to get much, much worse. People don’t have the money to start saving in the first place. They’re too busy keeping up with an extravagant and over-inflated lifestyle, taxes, fines and what have you not. On top of that, the United States has chosen a geo-political strategy that has led the rest of the world want off the US dollar. They don’t want to use it anymore. China is buying lots of gold. Russia is threatening to abandon the dollar altogether.
READ MORE

Please share this article

Two Sectors to Short in This Bounce

The stock market fired a warning shot earlier this month.
 
After setting a new all-time high above 1,894, the S&P 500 dropped 80 points – roughly 4.2% – in just two weeks. This fast downside action is just a small sample of what may happen when the stock market finally enters a correction phase.
 
But we're not there yet. As I said last week, the old bull market still has one more kick left in it. And the recent bounce is giving traders a chance to cash out on some long positions and make a short trade or two.
 
You see, the bounce is ending. As I told you on Tuesday, we're coming up on a seasonally weak period for stock prices. And there are two sectors in particular that look vulnerable for a decline...
 
Let's start with real estate. Here's a chart of the iShares U.S. Real Estate Fund (IYR)...
 
IYR fund chart
 
For the past six months, IYR has been trading in a bearish rising-wedge formation. In this pattern, a stock makes consistently higher highs and higher lows but the distance between each new high and low is smaller. Eventually, the stock has to break out of the pattern one way or another. When that happens, it usually results in a big move.  (more)
Please share this article

Stansberry Research: Black Label Show UNLOCKED (Ep. 149)


Please share this article

Eric Sprott & Chris Waltzek

from GoldSeekRadiodotcom:
 Billionaire-entrepreneur and founder of Sprott Asset Management, CEO Eric Sprott says the official economic numbers are bogus; most people realize they are paying more for life’s necessities than reported. Even after spending trillions of taxpayer dollars, the Fed has accomplished little other than put the US further into debtor’s prison. Last week, the EU put savings accounts with over 100,000 Euros at risk of confiscation – Eric Sprott says that investors across the pond should be bracing for something similar, unless of course savings are held in physical bullion, coins and bars. But tarry not, according to his research physical demand for gold exceeds global mining output; one nation (China) is consuming all of the gold produced in the entire Western world. Bank trading desks combine their financial clout with the leverage facilitated by paper contracts to manipulate the precious metals markets with impunity. He shares a recent headline story of a homeowner who found a container of gold coins in the backyard worth $30,000 when buried, now worth $10 million, illustrating the safe haven qualities of the yellow metal.
Click Here to Listen
Please share this article

To Whom Does the U.S. Government Owe Money?

On Tax Day 2014, the U.S. federal government owed its lenders over $17.577 trillion. Our chart below reveals who Uncle Sam's biggest creditors are:

The biggest surprise in this edition of our chart (compared to the previous edition) is the appearance of Belgium on the list, which jumped ahead of several other nations by more than doubling the amount that is being lent to the U.S. government from the small European nation over the last six months. Since Belgium is a major international banking center, what this really represents is the accumulation of U.S. debt by other foreign entities through Belgium's banks in much the same way as London's banks have historically served this role for countries such as China.
Here though, it appears that Russia-based interests may be behind the apparent surge in the nation's holdings of U.S. government-issued debt, with the driving factor being the desire to avoid losing access to the holdings from economic sanctions. Much of the increase in holdings through Belgium took place in the several months preceding Russia's 23 February 2014 actions to seize control of the Crimea peninsula from Ukraine, which indicates the very premeditated nature of the action.
Meanwhile, the U.S. Federal Reserve continues to accumulate the share of the U.S. government's debt, having gone from accounting for 1 out of every 8 dollars lent to the U.S. government to now account for nearly 1 out of every 7 dollars.

Data Sources

Federal Reserve Statistical Release. H.4.1. Factors Affecting Reserve Balances. Release Date: 17 April 2014. [Online Document]. Accessed 23 April 2014. [Data through 16 April 2014].
U.S. Treasury. Major Foreign Holders of Treasury Securities. Accessed 23 April 2014. [Data through February 2014].
U.S. Treasury. Monthly Treasury Statement of Receipts and Outlays of the United States Government for Fiscal Year 2014 Through March 30, 2014. [PDF Document]. [Data through March 2014].
Please share this article

Head and Shoulders Pattern in the Nasdaq

Since everyone is now starting to talk about this potential head and shoulders pattern, I figured I’d weigh in. First of all, looking for reversal patterns in general is a losing proposition as markets historically move in trends. Right now the trend in the Nasdaq is and has been up, so potential reversal patterns usually fail. With that said, it would be irresponsible of us not to recognize a potential pattern when it appears.
A month ago I put out a bearish note on the Nasdaq, where I explained why it was such an easy short entry. The risk/reward was perfect for the bears. So far this is working out nicely, but a bigger, more important topping pattern is starting to develop. Patterns with larger market implications take longer to build (see here). So far we’re going on 6 months of construction work for this price pattern. That’s not good.
Here is the daily candlestick chart for the Nasdaq100 $QQQ. There’s a reason people are starting to talk about this Head and Shoulders. The left shoulder is easily recognizable, the higher high representing the head rolled over nicely and found support at that neckline that’s held since December, and now a weak right shoulder is beginning to emerge:
 4-25-14 qqq
It’s still too early to know for sure if this is exactly what’s happening in the Nasdaq. The confirmation technically doesn’t come until prices break below the neckline. We’re still 3% away from there. In addition, the market doesn’t make it very easy on us. Way too often, we see brief new lows below necklines that then reverse and rip in your face. So if you do get that confirmation, and you’re following this pattern, you really only want to be short below the neckline. $76 looks like a solid initial price target in that case as it represents the $7.50 measured move based on the size of the reversal pattern.
In general, I don’t think it’s advantageous to search for patterns like this. But when they appear and confirm, they can provide some extremely violent moves. Look at the top for the S&P500 and Dow Industrials back in 2007; text book stuff.
Please share this article

Friday, April 25, 2014

Silver Forecast & Silver Miners Prediction

Silver Forecast: Last month Ross Clark and I had a long discussion about where we forecast silver price to be in 2014. Interestingly enough, we both has a similar prediction. Both of us have been watching silver like a hawk because historically the more silver lags and underperforms that of gold, the more bullish our silver forecast was in the long run.
The point of this article is to make you aware of a possible major breakdown in the US dollar index and to provide you with a silver forecast. If the dollar chart does in fact break down then we will see the Euro rally and see commodity based currencies like the Canadian dollar, and Aussie dollar rally. This would also be bullish for commodities in general.
The US dollar index is clearly showing a topping pattern which if broken will trigger a waterfall sell off in price. (more)

Please share this article

Pacira Pharmaceuticals Inc (NASDAQ: PCRX)

Pacira Pharmaceuticals, Inc. develops, commercializes, and manufactures pharmaceutical products primarily for use in hospitals and ambulatory surgery centers worldwide. It develops pharmaceutical products based on its proprietary DepoFoam drug delivery technology. The company commercializes EXPAREL, a liposome injection of bupivacaine, an amide-type local anesthetic indicated for administration into the surgical site to produce postsurgical analgesia; and DepoCyt(e), a liposomal formulation of the chemotherapeutic agent cytarabine indicated for the intrathecal treatment of lymphomatous meningitis, a cancer of the immune system. Its product pipeline comprise EXPAREL that has completed Phase III clinical trials for postsurgical analgesia-nerve block administration; DepoNSAID, which is in preclinical trials for the relief of acute pain; and DepoMethotrexate, an oncology preclinical candidate, as well as Bupivacaine Liposome Injectable Suspension for veterinary postsurgical analgesia.
To review Pacira’s stock, please take a look at the 1-year chart of PCRX (Pacira Pharmaceuticals, Inc.) below with my added notations:
1-year chart of PCRX (Pacira Pharmaceuticals, Inc.)
PCRX had formed a key level of support at $60.00 (green) over the last (4) months. In addition, the stock created a down trending resistance starting from the end of February (red). These two lines combined had PCRX stuck trading within a common chart pattern known as a descending triangle.
At some point, the stock had to break support or break its string of lower highs, and yesterday the stock broke through resistance. The prior level of $70 (blue) could be a potential support now.

The Tale of the Tape: PCRX formed a descending triangle pattern. A long trade could be made on a pullback to $70 with a stop placed below that level. A break back below $70 would set up a potential short trade.
Please share this article

Chart of the Day - Warren Resources (WRES)

The Chart of the Day is Warren Resources (WRES). I found the stock by sorting today's New High List for the best technical buy signals then used to Flipchart feature to review the charts. Since the Trend Spotter signaled a buy on 1/28 the stock gained 61.63%.

Please share this article

Advanced Micro Devices (NYSE: AMD) Stock Could Surge 45% in the Next 90 Days

Buying stocks that have fallen on hard times, or just out of Wall Street's favor, is a time-honored way to capture outsized returns. Price does not always reflect the actual value of a company, and finding these disconnects is one key to successful stock picking.
There are several ways to locate such stocks. The traditional way is to crunch the fundamentals to determine innate value. While this strategy can work, I consider it incomplete because it fails to consider the future. In other words, it's just a snapshot of now. It doesn't take into consideration the likelihood of the company's future plans adding value and lifting the stock price.  (more)

Please share this article

Gold & Silver Stocks Begin Oversold Bounce

The bottoming process for gold and silver shares has been arduous as they’ve oscillated back and forth for almost a year. We noted a month ago that the failed breakout in March (http://www.gold-eagle.com/article/failed-breakout-marks-interim-top)  was strong evidence that an interim top was in place. Heading into this week it looked like the miners would fall further before finding support. However, over the past two days the sector clearly reversed its short-term course. For now this appears to be a rebound from an oversold bounce.
We plot GDX, GDXJ and SIL in the chart below. As of Monday’s low, the miners were very oversold in a small space of time. From recent highs GDX was down 18%, GDXJ 27% and SIL 21%. Thus the miners were ripe for a bounce. The bullish reversal on Monday coupled with confirmation on Tuesday signals that a rebound is underway. The initial upside targets are the open gaps from six days ago and the 50-day moving averages.
Please share this article

Thursday, April 24, 2014

Buy Tesla While It's On Sale

Some stocks are considered good values, with attractive fundamental metrics such as a low P/E ratio, a low price-to-book ratio, etc. Some stocks are great technical plays, forming bullish double-bottom or cup-and-handle chart patterns.
Then there are some stocks that power higher because they have a genius CEO who brought a product to market at just the right time.
Tesla Motors (NASDAQ: TSLA) is one of the latter, and in my judgment, you'd be crazy not to own the stock at current levels.  (more)

Please share this article

Anacor Pharmaceuticals Inc (NASDAQ: ANAC)

Anacor Pharmaceuticals, Inc. focuses on discovering, developing, and commercializing novel small-molecule therapeutics derived from its boron chemistry platform. The company’s lead product candidates include tavaborole, an antifungal product candidate that is in Phase III clinical development for the treatment of onychomycosis; and AN2728, an anti-inflammatory product candidate, which completed Phase II clinical trials for the treatment of atopic dermatitis and psoriasis, and chronic inflammatory skin diseases. It also develops AN5568, a Phase I human clinical trial product targeting human African trypanosomiasis. The company’s clinical pipeline also includes AN2718, a topical antifungal product candidate, which is in Phase I clinical trials for the treatment of onychomycosis and fungal infections of the skin; AN2898, a topical anti-inflammatory product candidate that completed Phase IIa clinical trials for the treatment of atopic dermatitis and psoriasis; and AN3365, an antibiotic for the treatment of infections caused by Gram-negative bacteria. It has research, development, and collaboration agreements with GlaxoSmithKline LLC, Eli Lilly and Company, Schering Corporation, Medicis Pharmaceutical Corporation, Bill and Melinda Gates Foundation, and Medicines for Malaria Ventures.
To review Anacor’s stock, please take a look at the 1-year chart of ANAC (Anacor Pharmaceuticals, Inc.) below with my added notations:
1-year chart of ANAC (Anacor Pharmaceuticals, Inc.)
After forming a clear double top (green), ANAC confirmed that pattern when it broke below the $16 (blue) support. The expectation would have been for a bigger fall than just down to $14, but now the stock has broken back above $16. Higher prices should follow, most likely a run back up to at least the $18 (red) resistance.

The Tale of the Tape: ANAC is back above $16. A long trade could be made on a pullback to $16 with a stop loss placed under that level. A break back below $16 would be an opportunity to get short the stock.
Please share this article

Cotton Forming A Base And Is Ready To Go

This has so far been the year for agricultural commodities. If you’ve been in this space and stayed away from the US stock market, you’ve been doing great. Good for you. But either way, I think Cotton is worth taking a look at. This nice long base we’ve seen Cotton build over the last few years could be the catalyst to take this much higher. Some of it’s colleagues like Coffee, for example, have been on fire. I think this one can join the party.
The first chart shows a nice big base developing over the past few years. After an asset crashes like Cotton did in 2011, the only medicine is time (i.e. Tech after 2000). This base is exactly what was needed:
4-22-14 ct weekly
Now with those key resistance levels in mind, let’s call it 94-ish, take a look at this daily line chart. This is where we’ve been running into trouble for some time. But as always, the more times that a level is tested, the higher the likelihood that it breaks. This is the 4th test in a little over a year and 5th since 2012.  (more)
Please share this article

McAlvany Weekly Commentary: Central Banks Can’t Fix the System


Please share this article

Chart of the Day - Zillow (Z)

The Chart of the Day is Zillow (Z). I found the stock by sorting today's New High List for the stocks with the best technical indicators then reviewed the charts using the Flipchart feature. Zillow has a break out chart and since the Trend Spotter signaled a buy on 3/17 gained 14.69%.
Z is a real estate information marketplace. It help homeowners, buyers, sellers, renters, real estate agents, mortgage professionals, landlords and property managers find and share information about homes, real estate and mortgages. The Company provides information through their website and mobile applications.


Please share this article

Wednesday, April 23, 2014

“Sell in May and Go Away”

And just like that, we’re almost done with the month of April. So you know what that means? The ‘Sell in May and Go Away’ chatter now begins. Does it work? Does it not work? Should we always sell in May? Why does it work? Where does this come from? What if I’m more long-term? What if it’s a midterm election year? All great questions.
Let’s begin with where this originally came from. The old saying is officially,
“Sell in May and go away. Stay away till St. Leger’s Day”
The inference here is that there’s no point owning stocks during the summer. The big boys won’t get back to business until Horse Racing season in England is over in the Fall. The British have been celebrating this day in September since the St. Leger Stakes (last leg of the English Triple Crown) was established in 1776. In America, we like to call this time of the year, “Football Season”.
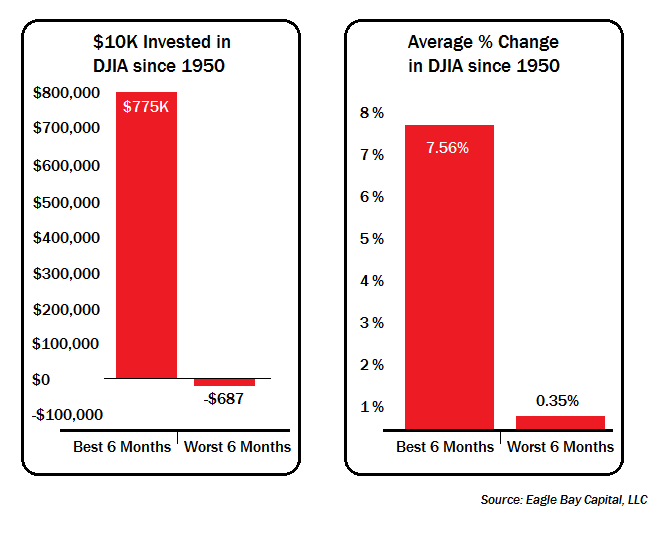
So should we listen? Does the math behind this make any sense? I think it does. If you use the Dow Jones Industrial Average and go back to 1950, the statistics are simply staggering. Hypothetically, had you invested $10,000 but only owned stocks between November 1st through April each year, on April 30th of 2013 that $10,000 would have been worth $775,055. That’s pretty awesome. Now, had you done the exact opposite and purchased the Dow Industrials every year on May 1 and sold on Halloween, you would have actually lost $687 over the past 63 years.
4-22-14 10k invested 1950 and avg perc
Look at the average percentage moves. You can choose to ignore those numbers if you want. But I like to think that seasonality is against us as we enter the summer season. Call me crazy.
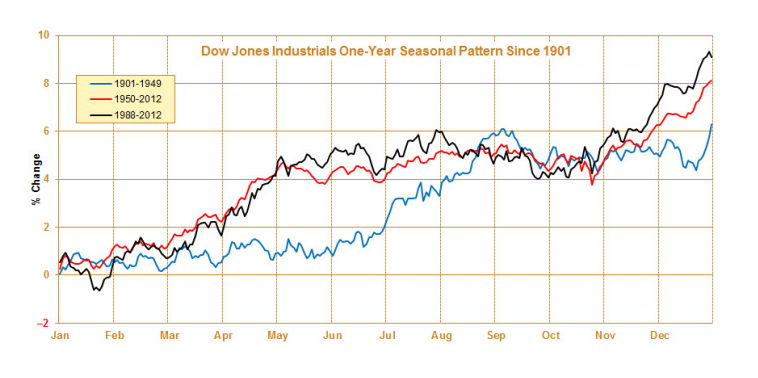
But it wasn’t always like this. In fact, before 1950 it was profitable to be a buyer in May. At the time, farming was the big driver of the US economy, so this made August the best month of the year from 1901-1950. Today, farming makes up less than 2% of the US Economy, so since 1987, August has actually been the second worst month of the year for the Dow and S&P.
Here is the one-year seasonal pattern from the Stock Traders Almanac. Look at the difference between the pre-1950 period compared with the behavioral patterns since then:
 4-22-14 1 yr seasonal since 1901
During mid-term election years, the numbers get even worse. Remember, this is traditionally the worst year of the 4-year Presidential Cycle. So the “worst six months” statistics warn us even more. The average return during this upcoming 6-month period on midterm years is -0.43%. The stats don’t lie. Here is the Presidential Cycle Composite chart for the S&P500 going back to 1928. Notice how historically, major bottoms are put in during the Fall of midterm years:
4-22-14 Presidential Cycle
Based on the Presidential Cycle and 6-month cycle, we are entering a period of time where the US Stock market tends to struggle. But if history is any indication, this could be one of the best buying opportunities we’ve had in years. But we’ll worry about that when the time comes.
I’ve been bearish about US Stocks all year long. This is just another feather on the hat for the bears and I don’t see any reason to be optimistic about the US Stock Market Indexes. There will always be individual non-correlated names that do well; that won’t change. But as far as the market as a whole is concerned, I will continue to keep a bearish/neutral stance. At least for now.
Please share this article

Billionaire Warns: Yellen Collapse ‘Will Be Unlike Any Other’

moneynews.com / 22 Apr 2014 05:27 PM
Another horrific stock market crash is coming, and the next bust will be “unlike any other” we have seen.
That’s the message from Jeremy Grantham, co-founder and chief investment strategist of GMO, a Boston-based firm with $117 billion in assets under management.
Grantham pulls no punches when he discusses who he holds responsible for the coming financial carnage. In a recent interview with The New York Times, he calls Federal Reserve Chair Janet Yellen “ignorant” and said the Federal Reserve all but killed the economic recovery.
He also says that he isn’t putting his clients’ money into the market right now.
“We invest our clients’ money based on our seven-year prediction. And over the next seven years, we think the market will have negative returns. The next bust will be unlike any other, because the Fed and other central banks around the world have taken on all this leverage that was out there and put it on their balance sheets. We have never had this before.”
Grimly, he adds, “It’s going to be very painful for investors.”
Grantham isn’t the only one worried about a market collapse.
READ MORE
Please share this article

Nasdaq Shorting Opportunity


Please share this article

Coca-Cola Enterprises Inc (NYSE: CCE)

Coca-Cola Enterprises, Inc. produces, distributes, and markets nonalcoholic beverages. It provides still and sparkling waters, flavored waters, juice and juice drinks, sports drinks, energy drinks, teas, and coffees. The company offers its products primarily under Coca-Cola, Diet Coke/Coke Light, Fanta, Coca-Cola Zero, Capri-Sun, Schweppes, Sprite, Chaudfontaine, Minute Maid, Oasis, Dr. Pepper, Monster, Nalu, Relentless, and POWERade Energy brands. It distributes its products through retailers, wholesalers, and other customers; and through licensed territory agreements in Belgium, continental France, Great Britain, Luxembourg, Monaco, the Netherlands, Norway, and Sweden.
To review Coca-Cola’s stock, please take a look at the 1-year chart of CCE (Coca-Cola Enterprises, Inc.) below with my added notations:
1-year chart of CCE (Coca-Cola Enterprises, Inc.)
Over the last (10) months CCE has trended overall higher, while during the most recent several months the stock has formed a trend line of support (green). Always remember that any (2) points can start a trend line, but it’s the 3rd test and beyond that confirm its relevance. However, the stock also had a key level of support at $46 (red) that should act as resistance if CCE’s rally continues.

The Tale of the Tape: CCE has a trend line support and a $46 resistance. A long position could be entered on a break above $46, or on a pullback to the trendline, with a stop placed below the level of entry. A short position could be entered if CCE were to break below trendline or if the rally continues up to $46.
Please share this article

David Einhorn: “We Are Witnessing Our Second Tech Bubble In 15 Years” – Full Letter


We have been saying for about 6 months that the second coming of the tech bubble is here. We are happy to learn that none other than hedge fund manager David Einhorn agrees. From his just released letter to clients:
We have repeatedly noted that it is dangerous to short stocks that have disconnected from traditional valuation methods. After all, twice a silly price is not twice as silly; it’s still just silly. This understanding limited our enthusiasm for shorting the handful of momentum stocks that dominated the headlines last year.
Now there is a clear consensus that we are witnessing our second tech bubble in 15 years. What is uncertain is how much further the bubble can expand, and what might pop it.
Please share this article

3 High-Yield ETFs Every Investor Should Own

Stock market volatility is sending some investors in search of safer investments.
Tech stocks in particular have been falling, with the Nasdaq dropping more than 5% in the last month.
For most investors, “safety” means two things: income and diversification.
One of the best investments for earning high yields and diversifying your portfolio are ETFs. Like mutual funds, ETFs often invest in more than 100 securities.  (more)

Please share this article

Tuesday, April 22, 2014

LEGEND WARNS STOCKS TO COLLAPSE, GOLD TO SKYROCKET & MORE – Victor Sperandeo:


kingworldnews.com / Sunday, April 20, 2014


PLEASE CLICK HERE TO LISTEN

Please share this article

A Bankrupt World, $26,000 Gold & The Destruction Of Wealth

kingworldnews.com / April 21, 2014
Today a 42-year market veteran spoke with King World News about a bankrupt world, $26,000 gold, and the destruction of wealth.  Below is what Egon von Greyerz, who is founder of Matterhorn Asset Management out of Switzerland, had to say in this powerful interview.
Greyerz:  “Eric, this is a good time for contemplation. As we have discussed many times, the risks in the world are greater than ever today….
READ MORE
Please share this article

magicJack VocalTec Ltd (NASDAQ: CALL)

magicJack VocalTec Ltd., together with its subsidiaries, operates as a cloud-based communications company that provides voice-over-Internet-Protocol (VoIP) services in the United States. The company’s products and services allow users to make and/or receive free telephone calls to and from where the customer has broadband access to the Internet. It offers magicJack VoIP device that enables customers to receive phone service for their home, enterprise, or while traveling; and magicJack PLUS, which contains a System on a Chip that connects a regular phone directly to the user’s broadband modem/router and function as a standalone phone without using a computer.
To review magicJack’s stock, please take a look at the 6-month chart of CALL (magicJack VocalTec Ltd.) below with my added notations:
6-month chart of CALL (magicJack VocalTec Ltd.)
CALL has formed a key price level of at $20.00 (purple) over the last (2) months that had most recently been support. In addition, the stock has potentially a down trending resistance that starts in mid-March (blue). The stock has started to recover from below $18 and should be approaching the $20 level soon, which may be where the down trending resistance is at that time.

The Tale of the Tape: CALL is approaching potentially 2 resistances at $20. A short trade could be made on a rally up to $20, while a break above $20 would set up a potential long trade.
Please share this article

Would You Short Lululemon LULU?‏

1. A specialty retailer trading at 25x earnings.
2. With negative same store sales comps:

3. Expanding into new locations with lower population density and income than current stores (which implies margin pressure going forward):
Note: Distinct Market Size per Store is comprised of spending on women’s apparel and sporting goods in a 10-mile radius trade area. Source: Signal Data.
4.  With worldwide online search trends that recently turned negative (side note: if you aren’t tracking worldwide search trends, you are missing out on huge alpha opportunities in the consumer / tech space; the correlation between search to sales is not insignificant – see here):

Would you short this company?
Please share this article

The Dow Jones Index is the Greatest of All Ponzi Schemes


http://i.investopedia.com/thumbnails/live/84_what-is-a-ponzi-scheme_421x236.jpgBeware: The Dow 30’s Performance is Being Manipulated!

The Dow Jones Industrial Average (DJIA) Index – the oldest stock exchange in the U.S. and most influential in the world – consists of 30 companies and has an extremely interesting and distressing history regarding its beginnings, transformation and structural development which has all the trappings of what is commonly referred to as pyramid or Ponzi scheme.
The Dow Index was first published in 1896 when it consisted of just 12 constituents and was a simple price average index in which the sum total value of the shares of the 12 constituents were simply divided by 12. As such those shares with the highest prices had the greatest influence on the movements of the index as a whole. In 1916 the Dow 12 became the Dow 20 with four companies being removed from the original twelve and twelve new companies being added. In October, 1928 the Dow 20 became the Dow 30 but the calculation of the index was changed to be the sum of the value of the shares of the 30 constituents divided by what is known as the Dow Divisor.
While the inclusion of the Dow Divisor may have seemed totally straightforward it was – and still is – anything but! Why so? Because every time the number of, or specific constituent, companies change in the index any comparison of the new index value with the old index value is impossible to make with any validity whatsoever. It is like comparing the taste of a cocktail of fruits when the number of different fruits and their distinctive flavours – keep changing. Let me explain the aforementioned as it relates to the Dow.
READ MORE
Please share this article

Monday, April 21, 2014

A. O. Smith Corp (NYSE: AOS)

A.O. Smith Corporation manufactures and sells water heaters and boilers to the residential and commercial end markets primarily in the United States, Canada, China, Europe, India, and the Middle East. It operates in two segments, North America and Rest of World. The company offers a line of electric, natural gas, liquid propane, solar tank, gas tankless, and electric water heaters for applications in residences, restaurants, hotels and motels, laundries, car washes, and small businesses; and residential and commercial boilers primarily for space heating applications in hospitals, schools, hotels, and other large commercial buildings. It also provides boilers and expansion tanks, commercial solar water heating systems, swimming pool and spa heaters, and related products and parts. The company sells its products through independent wholesale plumbing distributors, hardware and home center chains, and manufacturer representative firms. It sells water heaters to approximately 5,900 retail outlets, as well as water treatment products to 2,900 retail outlets in China.
To review A.O.’s stock, please take a look at the 1-year chart of AOS (A.O. Smith Corporation.) below with my added notations:
1-year chart of AOS (A.O. Smith Corporation.)
AOS has formed a key level of support at $45.00 (blue) over the last (3) months that it has been struggling to hold. In addition, the stock has created a down trending resistance starting from the end of December (green). These two lines combined have AOS stuck trading within a common chart pattern known as a descending triangle, and at some point, the stock has to break support or break its string of lower highs.

The Tale of the Tape: AOS has formed a descending triangle pattern. A short trade could be made on a break of the $45.00 support level. A break through $47.00 would break the down trending resistance and would set up a potential long trade.
Please share this article

Why Microsoft (Nasdaq: MSFT) Stock Is Going to $100

Shah Gilani, a retired hedge-fund manager who runs the Capital Wave Forecast and Short Side Fortunes advisory services here at Money Map Press, often makes counter-intuitive picks - like when he first recommended Microsoft Corp. (Nasdaq: MSFT) stock last summer.
Since then, Microsoft stock is up about 16% and trading at about $40 a share. But Gilani believes MSFT is doing a lot of things right and is destined to go much higher from here. 
Recently, Money Morning Executive Editor William Patalon III caught up with Gilani to get an update on why he thinks Microsoft is still among tech stocks to buy now.
Here's a partial transcript of that discussion.  (more)

Please share this article

Cambria Global Value ETF (GVAL) : This Fund Offers the Cheapest Stocks in the World

One of the big revelations for financial market strategists and pundits in 2014 has been the outperformance of value stocks.
This really shouldn’t be a surprise, though, as value tends to outperform growth over the long term.
For example, the Russell 1000 Value Index has returned an annualized 9.7% over the past decade, compared to the Russell 1000 Growth Index’s 8.4% annual total return.
But the rotation into value isn’t the only development we should be watching — foreign stocks have started to outperform the U.S. market, too.  (more)

Please share this article

Starbucks (NASDAQ: SBUX) Stock is in Danger of a Double-Digit Collapse

They say that half the battle is knowing which groups to own -- or to avoid. The reason is that a big chunk of a stock's movement can be attributed to its industry. If there is enough business to go around, then every stock with a decent balance sheet should benefit.
Conversely, when things sour for an industry, even household names can suffer. That is what we see now for the restaurant sector and Starbucks (NASDAQ: SBUX) in particular.  (more)

Please share this article

Chart of the Day Halliburton (HAL)

The "Chart of the Day" is Halliburton (HAL). I found the stock by scanning the Barchart "All Time High" list for the best technical indicators and then used the Flipchart function to review the charts. HAL rallied sharply in Feb-March, paused in early April, and then rallied this week to a new record high. TrendSpotter was long during Feb-March, took profits in early April, and just turned long again on Tuesday at $59.97.

Please share this article

US Weekly Economic Calendar

time (et) report period Actual forecast previous
MONDAY, APRIL 21
8:30 am Chicago Fed national activity March   -- -0.18 3-month
10 am Leading indicators March   -- 0.5%
Tuesday, APRIL 22
9 am FHFA home price index Feb.   -- 7.4% y-o-y
10 am Existing home sales March   4.55 mln 4.60 mln
WEDNESDAY, APRIL 23
9 am Market "flash" PMI April   -- 55.5
10 am New home sales March   450,000 440,000
Thursday, APRIL 24
8:30 am Jobless claims 4/245   315,000 304,000
8:30 am Durable goods orders March   1.8% 2.2%
FRIDAY, APRIL 25
9:55 am UMich consumer sentiment April   82.6 82.6
Please share this article

Saturday, April 19, 2014

Martin Armstrong – Reports of the Dollar’s Death are Greatly Exaggerated

from Financial Survival Network
We spoke with Martin Armstrong today about the Blood Moon, the Death of the Dollar, the crumbling Euro, and the ascent of China. While Martin sees China becoming the leading world economy eventually, he doesn’t see the dollar dying off as quickly as others do. He says that this is because there is no other currency to take its place at the present time. The war cycle is heating up at the same time as the civil unrest cycle… the first time this has happened since the 1700′s. Also the first of four Blood Moons has just passed, while the last will pass just as the Sovereign Debt Big Bang goes off in the third quarter of 2015. Interesting times ahead, that is for sure.
Click Here to Listen to the AudioPlease share this article

Billion Dollar Day - a 1986 documentary about currency (forex) speculative trading


Please share this article

The Frackers Gregory Zuckerman Unplugged (Ep. 231)


Please share this article

10 Ways to Screw up Your Retirement

There are many creative ways to screw up your retirement. Let me show you how it’s done.
Supporting adult children. My wife Jo and I have friends with an unmarried, unemployed daughter who had a child. Our friends adopted their grandchild and are now in their late sixties raising a kid in grade school. The same daughter had a second child, and they adopted that one too. When she announced she was pregnant a third time, they finally said, “Enough! It’s time for a third-party adoption.”
Last time I spoke with them, their unemployed daughter and her boyfriend were living in their basement, neither contributing financially nor lifting a finger around the house. What began as a temporary bandage had become a permanent crutch. Our friends love their grandchildren; however, they’ve become bitter.

READ MORE
Please share this article

Gold Forecast & Major Currency Is Collapsing

I want to make you aware of a possible major breakdown in the US dollar index and provide you with my gold forecast. If this scenario plays out then we will see the Euro explode to the upside and also see commodity based currencies like the Canadian dollar, and Aussie dollar rally. This would also be bullish for commodities in general like gold, silver, precious metals mining stocks etc…
The US dollar index chart below clearly shows a three year topping pattern with multiple price levels which when broken will trigger farther selling. These red horizontal lines on the chart show these price levels.
Critical support is around the 79.50 area which if breached should start a major wave of selling in the next few months. The initial wave of selling should take price all the way down to the 78.00 level before taking its first breather/pause.
*Trade Tip*
Most technical analysis books and traders think that the more times a support trend line has been touched the strong it becomes. That actually could not be any further from the truth.
Let me tell you how to trade trendlines.
1. You must have at least two pivot points (highs or lows) to be able to draw a trendline.
2. The 3rd and 4th touch of this line can be traded for a bounce.
3. Any touch of the trendline after the 4th is actually doing damage as it eats up the support volume.
4. A rising trendline like the one below clearly shows multiple pivot lows that when breached will trigger stops and flood the market with supply/sellers. It’s the perfect storm for a downward move.

Gold Forecast

My gold forecast has not changed in nearly a year as we wait for the gold market to bottom, then prove it’s self by breaking out of its basing pattern.
The bullish gold forecast is of the bigger picture. Most gold market traders and investors are caught up with the day to day price action and are growing tired of the range bound trading which gold has been doing for some time now.
In 2011 I pointed out the possible major topping pattern in gold, and that if price broke to new lows, then it would be lights out for at least a year if not two before the chart would build a new bullish base. And that leads us to my current gold forecast.

Gold Forecast & Gold Market Traders Conclusion:

In short, my gold forecast should be looked at from the big picture perspective. Getting involved in any gold stock, commodity or investment that is stuck in a range does carry more risk. It is easy to get shaken out of these positions a few times before the new bull market emerges.
The lowest risk position is to wait for the breakout of the basing pattern (yellow rectangle), only then can gold market traders get heavily involved to the long side.
Please share this article