Since everyone is now starting to talk about this potential head and
shoulders pattern, I figured I’d weigh in. First of all, looking for
reversal patterns in general is a losing proposition as markets
historically move in trends. Right now the trend in the Nasdaq is and
has been up, so potential reversal patterns usually fail. With that
said, it would be irresponsible of us not to recognize a potential
pattern when it appears.
A month ago I put out a
bearish note on the Nasdaq,
where I explained why it was such an easy short entry. The risk/reward
was perfect for the bears. So far this is working out nicely, but a
bigger, more important topping pattern is starting to develop. Patterns
with larger market implications take longer to build
(see here). So far we’re going on 6 months of construction work for this price pattern. That’s not good.
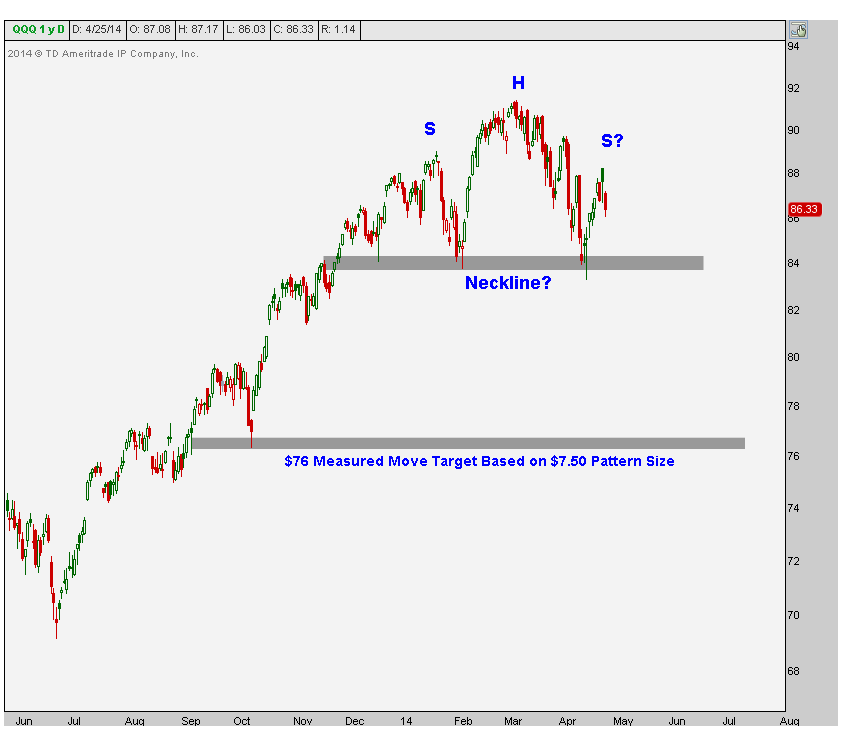
Here is the daily candlestick chart for the Nasdaq100
$QQQ.
There’s a reason people are starting to talk about this Head and
Shoulders. The left shoulder is easily recognizable, the higher high
representing the head rolled over nicely and found support at that
neckline that’s held since December, and now a weak right shoulder is
beginning to emerge:
It’s still too early to know for sure if this is exactly what’s
happening in the Nasdaq. The confirmation technically doesn’t come until
prices break below the neckline. We’re still 3% away from there. In
addition, the market doesn’t make it very easy on us. Way too often, we
see brief new lows below necklines that then reverse and rip in your
face. So if you
do get that confirmation, and you’re following
this pattern, you really only want to be short below the neckline. $76
looks like a solid initial price target in that case as it represents
the $7.50 measured move based on the size of the reversal pattern.
In general, I don’t think it’s advantageous to search for patterns
like this. But when they appear and confirm, they can provide some
extremely violent moves. Look at the top for the S&P500 and Dow
Industrials back in 2007; text book stuff.
Please share this article
No comments:
Post a Comment