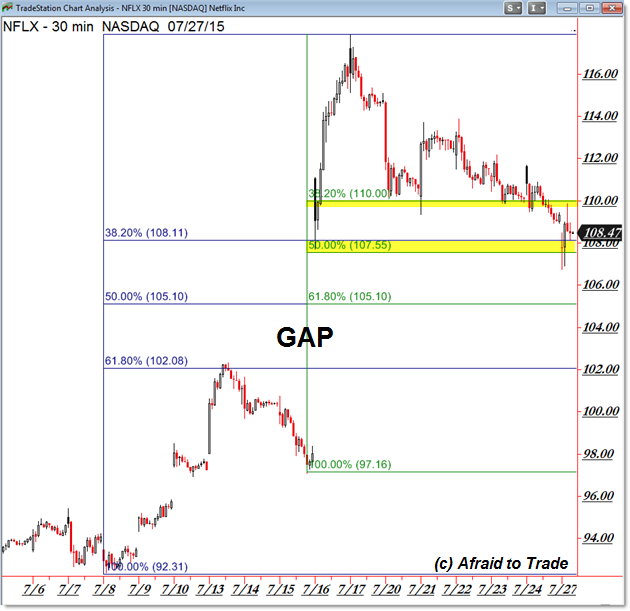
After a price surge and gap higher, Netflix (NFLX) shares are retracing in an ongoing uptrend.
For traders, there’s a clear price level to watch for clues to the future action – and opportunities.
Let’s pinpoint this level and update our price targets for Netflix (NFLX):
We’re seeing the 30-min Intraday Chart above with two key Fibonacci Retracement Grids drawn for you.
The first grid begins with the $92.30 per share swing low from July while the second grid is the bottom of the gap.
Both grids are drawn to the $117.00 level which was the “gap and run” spike high on July 16th.
Let’s first focus on the tighter 38.2% Level of the gap – it is $110.00 per share exactly. (more)
Tuesday, July 28, 2015
High Yield Breakdown
Could the high yield bond market be sending a precursor message to the Fed, signaling them not raise rates until 2016?
While that’s a notable possibility, the market just doesn’t seem hungry enough to gobble up excess inventory from record outstanding high yield debt levels. Especially with intermediate to long-term fundamental challenges such as the imminent probability of a short-term interest rate hike and a barbell shaped rollover calendar centered in the 2019-2020 time frame.
These key convergences, alongside a spotty risk asset environment, have caused a breakdown from the established 2015 trading range in both the iShares High Yield Bond ETF (HYG) and SPDR High Yield Corporate Bond ETF (JNK). Nevertheless, investors should take note that defaults have not meaningfully ticked higher and junk bonds are basically flashing the same warning signs as equities. All the while, the credit markets feel sluggish and opportunities viewed through the lens of risk aversion seem sparse.
Looking at a total return attribution, with most high yield bond indexes yielding between 5-6%, investors have experienced slowly eroding bond prices with merely the income to keep them near the flat line for the year. (more)
Brunswick Corporation (NYSE: BC)
Brunswick Corporation designs, manufactures, and markets recreation
products in the United States and internationally. The company’s Marine
Engine segment offers outboard engines, sterndrive propulsion systems,
and inboard engines under the Mercury, Mercury MerCruiser, Mariner,
Mercury Racing, Mercury Sport Jet and Mercury Jet Drive, MotorGuide,
Axius, and Zeus brands; and marine electronics and control integration
systems, steering systems, instruments, controls, propellers, trolling
motors, fuel systems, service parts, and marine lubricants under the
Quicksilver, Mercury Precision Parts, Mercury Propellers, Attwood, Land N
Sea, Kellogg Marine Supply, Diversified Marine Products, Bell
Recreational Products, Sea Choice, and MotorGuide brands, as well as
supplies integrated diesel propulsion systems.
Take a look at the 1-year chart of Brunswick (NYSE: BC) with the added notations:
BC has been trading sideways for all of 2015. Along the way, the stock has found support at $50 (green) several times. Now that the stock appears to be falling back down to that support level again, traders could expect some sort of bounce. However, if the $50 support were to break, lower prices should follow.
The Tale of the Tape: BC has an important level of support at $50. A trader could enter a long position at $50 with a stop placed under the level. If the stock were to break below the support a short position could be entered instead.
Subscribe to:
Posts (Atom)