For traders, there’s a clear price level to watch for clues to the future action – and opportunities.
Let’s pinpoint this level and update our price targets for Netflix (NFLX):

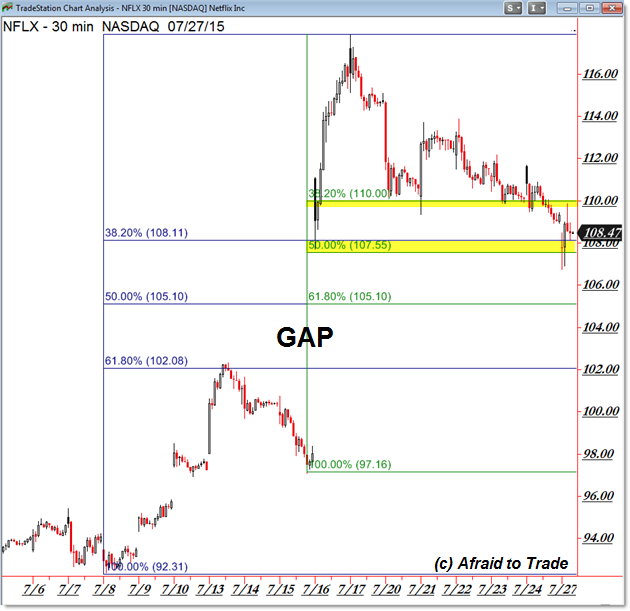
We’re seeing the 30-min Intraday Chart above with two key Fibonacci Retracement Grids drawn for you.
The first grid begins with the $92.30 per share swing low from July while the second grid is the bottom of the gap.
Both grids are drawn to the $117.00 level which was the “gap and run” spike high on July 16th.
Let’s first focus on the tighter 38.2% Level of the gap – it is $110.00 per share exactly. (more)
No comments:
Post a Comment