Tuesday, May 6, 2014
Leo Wanta revelations "The $27 Trillion Man" C2C May 3, 2014
Guest host Richard Syrett welcomed biographer Marilyn Barnewall, who detailed how Reagan-era intelligence agent Leo Emil Wanta attempted to cause the financial collapse of the Soviet Union. Wanta, himself, joined the conversation during the latter half of the program to discuss his battles with the US government over the fortune he amassed. Barnewell noted that Wanta's involvement with the intelligence community began when he was in his teenage years and, while working for the John Birch Society, he would surreptitiously deliver the organization's trash to FBI agents interested in tracking their activity. His role in the intelligence community culminated when Ronald Reagan became president and Wanta was enlisted to be a part of a secret task force aimed at disrupting the Soviet economy.
According to Barnewell, the task force determined that, using $150 billion dollars, they could successfully pull off this mission and Wanta was put in charge of the plot. From there, she said, Wanta journeyed to Vienna and created a company which traded various currencies, in exchange for rubles, with allies of the Soviet Union as well as forces within that nation. Barnewell explained that the ruble had become overvalued by the Soviet Union and, thus, people were eager to trade it for a more stable currency. This allowed Wanta to accumulate a vast amount of rubles for a fraction of what the Soviet Union had valued them. In turn, Wanta would sell the rubles, at a profit, to nations that were indebted to the Soviet Union, allowing them to repay their debt at a far cheaper rate, which decimated the Soviet economy.
Ultimately, Barnewell claimed that Wanta's wealth, as a result of his financial machinations, totaled a stunning $27.5 trillion dollars. After paying the United States back its $150 billion that originally funded the enterprise, he retained possession of the massive fortune. Wanta, who joined the conversation in the latter half of the program, contended that his agreement with Reagan, regarding this profit from the enterprise, was that the money should be used to benefit the American people. However, he declared that Congress could not be trusted with the funds and that the Federal Reserve is an illegal enterprise and, thus, had no right to the money. As such, Wanta said that, until assurances can be made that the money will be truly spent on the American people, he will never turn over the funds to the United States government, despite attempts made over the years to coerce him into doing so.
Please share this article
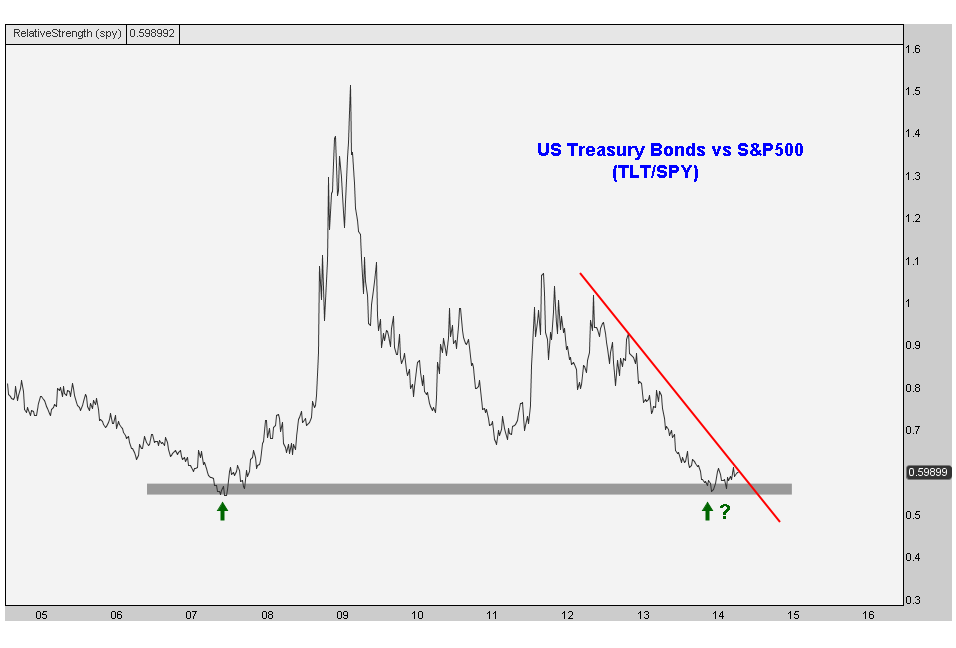
Buy Bonds and Sell Stocks
Last week I posted a chart
without any labels on it so that we can focus on price, and ignore any
biases we may have had. I received a lot of great feedback and
commentary that mostly revolved around buying this particular chart as
long as it remained above those 2007 lows.
As you can see here, this was actually a ratio chart with US Treasury Bonds as the numerator and S&P500 as the denominator:
 It looks to me like this is still a good risk/reward that favors
bonds over stocks. Further confirmation would come after a breakout
above this red downtrend line. So far this has been a great year for
bonds, but not so much for stocks. I think this trend persists as the extreme bearish sentiment from late last year continues its epic unwind.
It looks to me like this is still a good risk/reward that favors
bonds over stocks. Further confirmation would come after a breakout
above this red downtrend line. So far this has been a great year for
bonds, but not so much for stocks. I think this trend persists as the extreme bearish sentiment from late last year continues its epic unwind.
I really find value in flipping charts upside down, eliminating labels, and figuring out ways to make both bullish and bearish arguments for various positions we have on or are looking to put on. If you’re only taking one side on a consistent basis, I think you’re only lying to yourself. It’s about keeping an open mind and not taking what you think too seriously.
The market is going to do whatever it wants no matter how much homework you’ve done or think that you’ve done. So I think it’s in our best interest to always question what we’re thinking or doing. As the data changes, making adjustments to our outlook is something that we pride ourselves on. But so far in 2014, the price action just continues to confirm what we believed coming into the year. As soon as something is different, we’ll adjust.
Please share this article
As you can see here, this was actually a ratio chart with US Treasury Bonds as the numerator and S&P500 as the denominator:
I really find value in flipping charts upside down, eliminating labels, and figuring out ways to make both bullish and bearish arguments for various positions we have on or are looking to put on. If you’re only taking one side on a consistent basis, I think you’re only lying to yourself. It’s about keeping an open mind and not taking what you think too seriously.
The market is going to do whatever it wants no matter how much homework you’ve done or think that you’ve done. So I think it’s in our best interest to always question what we’re thinking or doing. As the data changes, making adjustments to our outlook is something that we pride ourselves on. But so far in 2014, the price action just continues to confirm what we believed coming into the year. As soon as something is different, we’ll adjust.
Please share this article
Top 10 Dividend Stocks to Buy and Hold ‘Forever’
Income investing isn’t just about the yield…
Sure, the following ten stocks pay a yield that’s above 3%, but nearly all of these companies dominate their respective industries.
Plus, they’ve upped their annual dividend payments for at least a decade. After all, the biggest part of finding “forever” investments are those with long track records of dividend increases. (more)
Please share this article
Three key metrics to identify a superstar mining investment
Etienne Moshevich, editor of Alphastox.com, looks at three things before he decides to get excited about a company: people, projects and structure. In this interview with The Mining Report,
Moshevich explains his ground-up approach to evaluating junior resource
companies and names the names that are set to rake in the profits.
The Mining Report: Alphastox.com follows junior equities in everything from gold, silver and diamonds to uranium, oil and gas. Why did you choose those particular market segments?
Etienne Moshevich: If you invested wisely and at the right time—meaning in companies that have the right management teams, the right projects and the right capital structure—there's a lot of upside in those segments. Every day I come to work, there's a new opportunity for me to relay to my subscribers. (more)
Please share this article
Lattice Semiconductor Corp. (NASDAQ: LSCC) Stock is an Immediate 'Buy'
.png)
I soon found out that measuring a stock's relative price strength, or simply relative strength (RS), was a key filter used to identify the stocks the smart money was banking on for market-beating returns. (more)
Please share this article
Teradata Corporation (NYSE: TDC)
Teradata Corporation provides analytic data platforms, marketing and
analytic applications, and related consulting services in the United
States and internationally. Its analytic data platforms comprise
software, hardware, and related business consulting and support services
for data warehousing, active intelligence, big data analytics, and data
discovery. The company’s products comprise Teradata Analytic Database
Software that delivers near real-time intelligence; Teradata
Workload-Specific Platforms; Teradata Aster Discovery Platform, which is
pre-configured with Teradata Aster Database; and Teradata Logical Data
Models that are blueprints for designing an integrated data warehouse.
It also provides Teradata Integrated Marketing Applications, which helps
organizations in managing marketing workflows, budget allocation,
leads, analytics, and digital assets; Teradata Marketing Operations for
marketing resource management; Teradata Campaign Management for planning
and performance analysis; and Teradata Digital Messaging for executing
personalized communications and delivering customer experiences, as well
as Teradata Analytic Applications.
Please take a look at the 1-year chart of TDC (Teradata Corporation) below with my added notations:

Over the last 2 months TDC has created a key level of support at around $45 (blue) and that $45 level is also the “neckline” support for TDC’s H&S reversal pattern. Above the neckline you will notice the H&S pattern itself (green). Remember, patterns such as an H&S need to confirm to have the meaning that they imply. Confirmation of the H&S would occur if the stock were to break below its $45 support.
The Tale of the Tape: TDC seems to have formed a head & shoulders pattern. Although a long trade could be made at $45, the pattern implies that the stock might be preparing to break lower. A short trade could be entered on a solid move below the $45 “neckline” support.
Please share this article
Please take a look at the 1-year chart of TDC (Teradata Corporation) below with my added notations:
Over the last 2 months TDC has created a key level of support at around $45 (blue) and that $45 level is also the “neckline” support for TDC’s H&S reversal pattern. Above the neckline you will notice the H&S pattern itself (green). Remember, patterns such as an H&S need to confirm to have the meaning that they imply. Confirmation of the H&S would occur if the stock were to break below its $45 support.
The Tale of the Tape: TDC seems to have formed a head & shoulders pattern. Although a long trade could be made at $45, the pattern implies that the stock might be preparing to break lower. A short trade could be entered on a solid move below the $45 “neckline” support.
Please share this article
Subscribe to:
Posts (Atom)