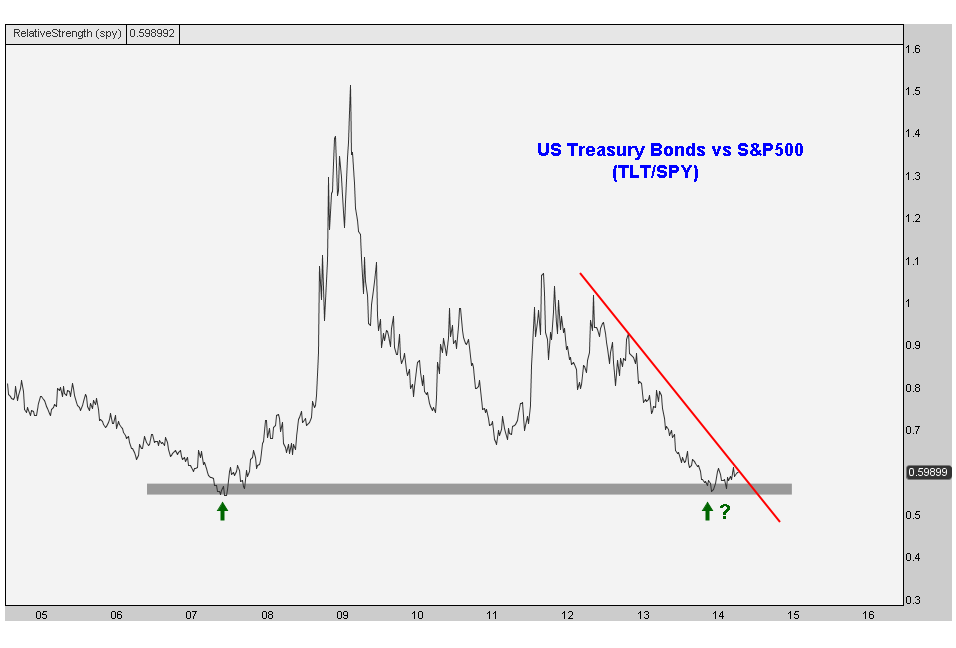
As you can see here, this was actually a ratio chart with US Treasury Bonds as the numerator and S&P500 as the denominator:
I really find value in flipping charts upside down, eliminating labels, and figuring out ways to make both bullish and bearish arguments for various positions we have on or are looking to put on. If you’re only taking one side on a consistent basis, I think you’re only lying to yourself. It’s about keeping an open mind and not taking what you think too seriously.
The market is going to do whatever it wants no matter how much homework you’ve done or think that you’ve done. So I think it’s in our best interest to always question what we’re thinking or doing. As the data changes, making adjustments to our outlook is something that we pride ourselves on. But so far in 2014, the price action just continues to confirm what we believed coming into the year. As soon as something is different, we’ll adjust.
Please share this article
No comments:
Post a Comment