Recent swings and reversals in commodity markets give us an example to study lengthy divergences and reversal trading tactics.
Let’s take a look at these larger reversals, note the supply/demand
shift, and the dual divergence chart signals that preceded these
reversals (for lessons of identification and trading similar situations
in the future).
We’ll start with Corn (@C):
After a similar Rounded Reversal pattern off the January lows (with
divergences), we see a peak into the $520 level on a triple-swing (three
price highs) negative momentum divergence into a resistance level.
Note the three spike-reversal candles that developed into (above) the upper Bollinger Band level also into $520.
The lengthy negative volume and momentum divergence undercut (failed to confirm) the price high into the resistance ceiling.
Generally we measure price (uptrending or making higher highs) along
with momentum and volume (forming lower highs) and note the lower lows
in volume and momentum with the higher highs in price.
Divergences never guarantee reversals, but divergences often precede
price reversals. We still need price to confirm the reversal by
breaking key support levels or else the rising 50 period EMA.
Next up is Wheat (@W):
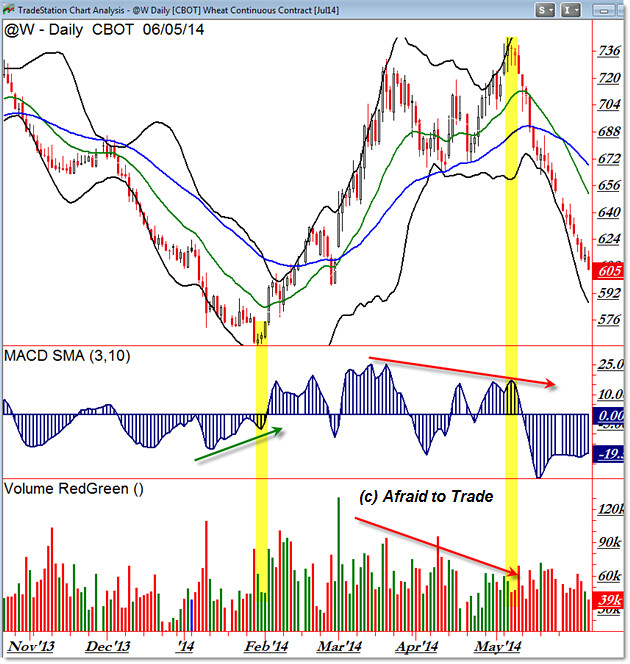
Similarly, Wheat formed a sharp reversal up off the January low and
then trended up into a slight double top or clear negative momentum and
volume divergence into the $736 level.
Likewise, price traded down back to the rising 50 EMA and then broke
the rising trendline and 50 EMA level to develop a sell-signal and
breakdown event.
Finally, we have a similar reversal example in Coffee (@KC):
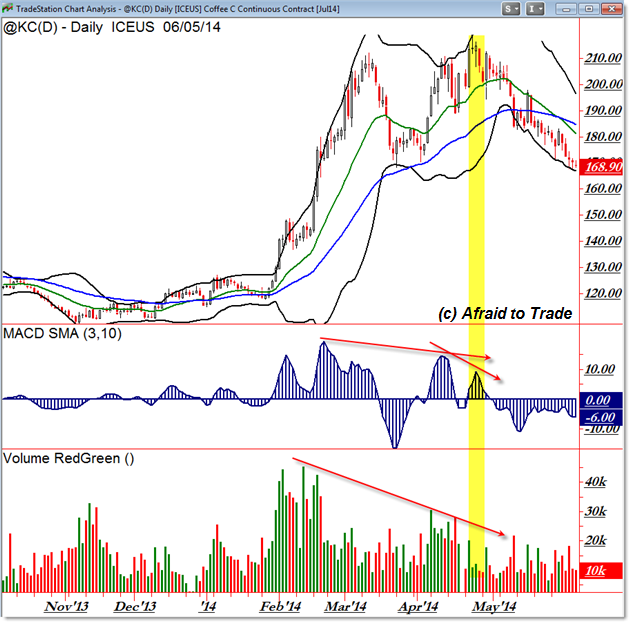
Coffee formed a similar double-top or clear dual divergent high above
$210 like Wheat. Price traded down to the rising 50 EMA and then broke
the level for a confirmed sell-signal to trigger a reversal.
Among the other lessons to study from these charts, pay close
attention to the interaction of the price trend – final price high – and
the negative dual divergence with the momentum oscillator and volume.
Please share this article
Friday, June 6, 2014
PPG Industries Inc. (NYSE: PPG)
PPG Industries, Inc. manufactures and distributes coatings, optical
and specialty materials, and glass products. The company operates in
five segments: Performance Coatings, Industrial Coatings, Architectural
Coatings, Optical and Specialty Materials, and Glass. It offers coatings
products for automotive and commercial transport/fleet repair and
refurbishing, light industrial coatings, and specialty coatings for
signs; sealants, coatings, maintenance cleaners, and transparencies for
commercial, military, regional jet, and general aviation aircraft and
transparent armor for specialty applications; and coatings and finishes
for the protection of metals and structures to metal fabricators, heavy
duty maintenance contractors, and manufacturers of ships, bridges, and
rail cars.
To review PPG’s stock, please take a look at the 1-year chart of PPG (PPG Industries, Inc.) below with my added notations:
PPG has been trending primarily higher for most of the year. The stock had also created a clear level of resistance at that $200 (red) over the last 3 months, which was also a 52-week high resistance. A break through that level would most likely mean higher prices for the stock, and as you can see from the chart, PPG finally broke higher last week.
The Tale of the Tape: PPG broke out to a new 52-week high. A long trade could be made near $200 with a stop placed below that level. A break back below $200 would negate the forecast for a continued move higher.
Please share this article
What I learned about junior mining stocks could shock you
From January 2005 to May 2007, the Toronto Venture Exchange (TSX V)
rose 254%. That’s a huge move higher for an index. The TSX V is the home
to nearly all of North America’s junior mining stocks. So that steep
climb includes the performance of the junior miners.
I believe we are in the early stage of a new bull market in junior mining stocks. In order to understand what we could see over the next few years, I’m going to take a closer look at what happened to those stocks from 2005 to 2007 on the way up and then from 2007 to 2008, when the whole thing collapsed.
The index, however, doesn’t tell the whole story. The mining stocks listed on the TSX V performed quite differently from the whole index, as you would expect. When we break out the individual performances, we see some important differences. (more)
Please share this article
Oil Prices: Smart Money Skeptical At $103 Per Barrel
One of several investor asset-flow based investor sentiment metrics
that we track is the weekly Commitments of Traders (CoT) data.
The CoT data, compiled and published by the Commodity Futures Trading Commission (CFTC), breaks down futures open interest to determine and disclose how several different types of investor are positioned in the marketplace.
One COT data series that has caught our attention recently is the current positioning of the Commercial Hedger and Large Speculator categories in crude oil futures. (more)
Please share this article
Subscribe to:
Posts (Atom)