Tuesday, April 8, 2014

50 Jobs over $50,000 – Without a Degree (Part 1)

When people write to me for help, I’m often confronted with a dilemma. Many of them are hardworking and intelligent people who are making reasonable financial choices, but due to the non-negotiable nature of Math, not ending up with as large a monthly surplus of cash at the end of each month as their higher-income counterparts.

Even more troubling are letters from recent graduates in fields like liberal arts or even law.
“My degree was expensive”, they tell me, “But the jobs that are out there in my field don’t pay enough to get me out of this huge student loan debt hole.” “How am I supposed to get a nice bushy ‘Stash, when we don’t have a six-figure household income like so many of the other MMM readers seem to have? I’m over 30 years old, and I only recently cracked $40,000 in income.”
The thing about earning money is this: nobody is going to pay you any more money than they have to. So if you want the benefit of a higher income, the first step is to make sure you’re not being complacent with your lower one.  (more)

Please share this article

T. Boone Pickens Talks Peak Oil


Please share this article

Dive in Momentum Stocks Resumes: Nasdaq Takes a Hit, Rotation Into 'Safe' Sectors Continues

On Friday momentum stocks sold off with some verve again after the release of the payrolls data. Since the latter were actually quite close to the expected number, they cannot really have been the trigger of the sell-off (in other words, it would probably have happened regardless of the data). A few weeks ago, Charles Biederman of TrimTabs warned that the upcoming tax season could lead to some selling, but there is also the presidential cycle to consider. If the market continues to follow this particular cycle model (it has actually done so year-to-date), it should decline from an April high into an October low. What makes the recent market action interesting is that there continue to be multiple divergences in evidence between different indexes:

RUT,NDX,DJIA,SPX-divergences
Russell 2000 Index, NDX, DJIA and SPX – the former two have been in sync, but have diverged from the other indexes. There are many more intra-market divergences between different sub-sectors that have been put in place over recent months.  (more)

Please share this article

Warren Buffett Video- The World's Greatest Money Maker


BBC Documentary on Warren Buffett, formally the world's richest man. Including interviews with co-investors, family members, and the man himself.
 
Please share this article

JinkoSolar Holding Co., Ltd. (NYSE: JKS)

JinkoSolar Holding Co., Ltd. engages in designing, developing, producing, and marketing photovoltaic products in the People’s Republic of China and internationally. It offers solar modules; solar cells; silicon ingots and silicon wafers; recovered silicon materials; solar power project development and solar system integration services; and processing services. The company sells its solar modules to distributors, project developers, system integrators, and other players in the solar power industry under the JinkoSolar brand, as well as on an original equipment manufacturer basis.
To review Jinko’s stock, please take a look at the 1-year chart of JKS (JinkoSolar Holding Co, Ltd.) below with my added notations:
1-year chart of JKS (JinkoSolar Holding Co, Ltd.)
Since November of last year JKS has essentially been trading sideways while forming a common pattern known as a rectangle. A minimum of (2) successful tests of the support and (2) successful tests of the resistance will give you the pattern. JKS’ rectangle pattern has formed a $37.50 resistance (red) and a $25 support (blue). A break above $37.50 would also be a new 52-week high.
One other level to watch is the downtrending resistance (DR) on JKS. If the stock is heading lower, that trendline could be the stopping point. A break though that line should mean a run back up to $37.50

The Tale of the Tape: JKS is trading within a rectangle pattern. The possible long positions on the stock would be either on a pullback to $25, on a break through the DR, or on a breakout above $37.50. The ideal short opportunity would be at the DR, or on a break below $25.
Please share this article

Energy Stocks Reach Bargain Basement Prices

It was November 1998. Oil was bottoming near $10 a barrel — a level last touched a decade earlier and never to be seen again. Exxon and Mobil were planning their merger.
If you’d bought XOM at the time, you’d be sitting on a gain of 160% by now, not including dividends. An S&P 500 index fund would be up barely 50%, and only after climbing out of the basement since 2009.

No point in kicking yourself… because you have the chance to repeat that performance now. Actually, you have the chance to achieve far bigger gains in much less time…
“Energy stocks have been shunned by investors and have languished in recent years,” writes our friend Frank Holmes, chief of the U.S. Global mutual-fund family.

Expectations for global growth and oil demand are in the tank. Thus, oil stocks held in the Energy Select SPDR ETF have underperformed the broad market by 32% since 2008, according to Goldman Sachs.
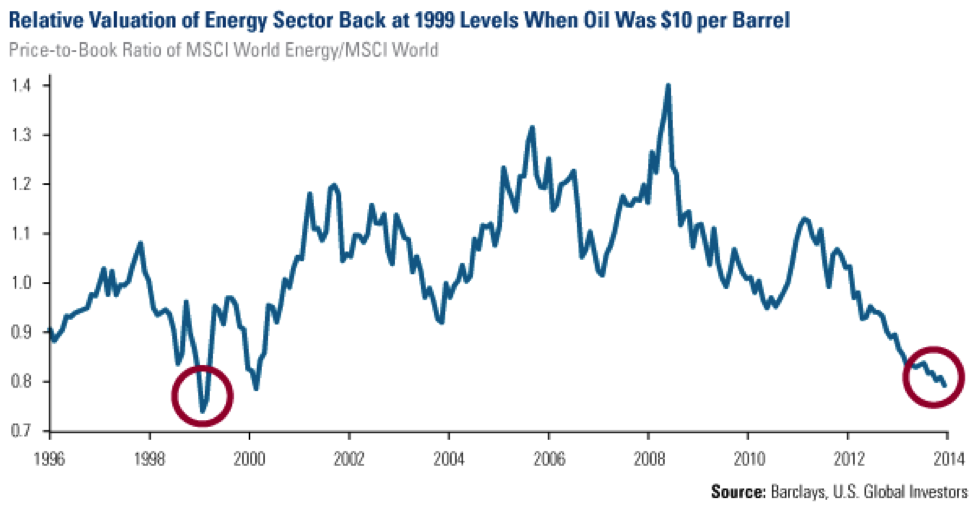
And check out this chart from Frank: It compares the price-to-book valuations of the MSCI World Energy Index with that of the MSCI World Index — basically weighing the global energy sector against the broad stock market worldwide. The ratio sits near a low last reached in… [drum roll, please]… November 1998, when oil bottomed near $10 and Exxon and Mobil were planning their merger.

Relative Valuation of Energy Stocks at 1999 Levels When Oil Was $10 per Barrel
Frank’s conclusion: “Today, with oil hovering around $100 a barrel and improved economic conditions in the U.S., energy stocks appear to be a tremendous bargain compared to overall stocks.”

“Be careful what you read,” writes Matt Insley of our resource-investing desk.
He spotted a Bloomberg story that says the rough winter has depleted natural gas storage: “Waves of frigid weather through March pushed stockpiles to the lowest level in 11 years. Almost 3 trillion cubic feet of gas will need to go into storage during the warm-weather months to cover winter demand, something that’s never been done before.”

Well yes, but… “Following Bloomberg’s logic,” says Matt, “you’d wonder how we’d ever dig ourselves out of this hole! We’ve lowered our inventories beyond help! How will we ever produce that much natural gas?”

The answer — easily.
Please share this article