Thursday, September 24, 2015

The Forecaster Martin Armstrong Documentary, Watch Online Free


MARTIN ARMSTRONG, once a US based trillion dollar financial advisor, developed a computer model based on the number pi and other cyclical theories to predict economic turning points with eerie accuracy. In the early 80s he established his financial forecasting and advising company Princeton Economics. His forecasts were in great demand worldwide. As Armstrong's recognition grew, prominent New York bankers invited him to join "the club" to aid them in market manipulation. Martin repeatedly refused. Later that same year (1999) the FBI stormed his offices confiscating his computer model and accusing him of a 3 billion dollar Ponzi scheme. Was it an attempt to silence him and to prevent him from initiating a public discourse on the real Ponzi Scheme of debts that the world has been building up for decades? Armstrong predicts that a sovereign debt crisis will start to unfold on a global level after October 1, 2015 - a major pi turning point that his computer model forecasted many years ago.

PLEASE RECOMMEND with Facebook, Twitter, and G+1
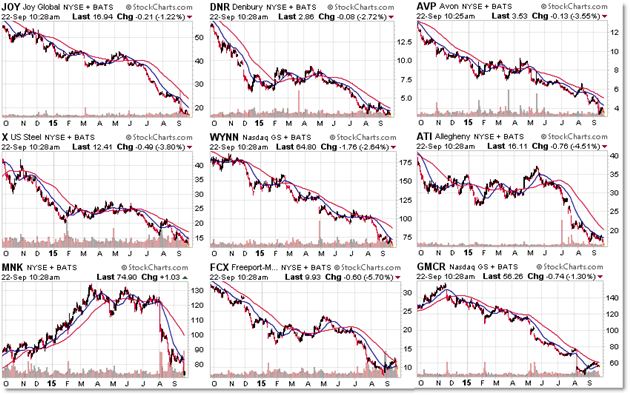
Nine Weak Downtrending Stocks in the S&P500: JOY, DNR, AVP, X, WYNN, ATI, MNK, FCX, GMCR

Here’s the list of weak stocks downtrending in the S&P 500:

These stocks continue to show relative weakness and downtrends as defined by lower price lows with lower price highs; we also note the bearish orientation of the moving averages.
In no particular order, we note the weakness of the following:
Joy Global (JOY)
Denbury (DNR)
Avon Products (AVP)
US Steel (X)
Wynn Resorts (WYNN)
Allegheny (ATI)
Mallinckrodt (MNK)
Freeport-McMoRan (FCX)
Keurig Green Mountain Coffee Roasters (GMCR)
The strategy would be to trade (short-sell) retracements (like bear flags) in these stocks as the trends weaken.

Gulfport Energy Corporation (NASDAQ: GPOR)

Gulfport Energy Corporation engages in the acquisition, exploration, exploitation, and production of natural gas, natural gas liquids (NGLs), and crude oil in the United States. The company’s principal properties are located in the Utica Shale primarily in Eastern Ohio; Louisiana Gulf Coast in the West Cote Blanche Bay; and Hackberry fields. It also has interests in the Niobrara Formation of Northwestern Colorado; Bakken Formation; entities that operate in Southeast Asia, including the Phu Horm gas field in Thailand; and Alberta oil sands located in Canada. As of December 31, 2014, the company had 933.6 Bcfe of proved reserves, as well as undeveloped reserves totaled 3,778 thousands of barrels oil, 373,840 millions of cubic feet natural gas, and 13,889 thousands of barrels of NGLs.
Take a look at the 1-year chart of Gulfport (NASDAQ: GPOR) below with added notations:
1-year chart of Gulfport (NASDAQ: GPOR)
After its April through July decline, GPOR started trading sideways over the next couple of months. While in that sideways move, the stock has formed a common pattern known as a rectangle. A minimum of (2) successful tests of the support and (2) successful tests of the resistance will give you the pattern.
GPOR’s rectangle pattern has formed a resistance at $36 (red), and an $32 support (green), which it barely held yesterday. At some point the stock will have to break one of the two levels.

The Tale of the Tape: GPOR is trading within a rectangle pattern. The possible long positions on the stock would be either on a pullback to $32 or on a breakout above $36. The ideal short opportunity would be on a break below $32.

Youku Tudou Inc (NYSE: YOKU)

Youku Tudou Inc. operates as an Internet television company in the People’s Republic of China. Its Internet television platform enables users to search, view, and share video content across various devices. The company’s services for users comprise online video content library consisting primarily of professionally produced content, including television serial dramas, movies, current event reports, variety shows, and music videos. It also provides guided user-generated content through Youku Paike and Youku Niuren programs; and produces a range of content, such as sponsored Web serial dramas, reality shows, interviews, and variety shows under the Youku Originals brand, as well as on Tudou platform.
Take a look at the 1-year chart of Youku (NYSE: YOKU) below with added notations:
1-year chart of Youku (NYSE: YOKU)
YOKU skyrocketed back in the spring, but after a persistent selloff in June, July and August, the stock started trading sideways over the past month. While in the sideways move, the stock has formed a key pair of price levels that are worth watching. YOKU has a current resistance at $18 (red), which has been both prior support and resistance earlier in the year, and a $16 support (green) that has also been both support and resistance in the past. At some point one of those levels will have to break.

The Tale of the Tape: YOKU is trading inside a trading range. The possible long positions on the stock would be either on a pullback to $16 or on a breakout above $18. The ideal short opportunity would be on a break below $16.