Thursday, July 31, 2014

Stock trader who called three crashes sees 20% collapse

Mark Cook, a veteran investor included in Jack Schwager’s best-selling book, “Stock Market Wizards,” and the winner of the 1992 U.S. Investing Championship with a 563% return, believes the U.S. market is in trouble.

The primary indicator that Cook uses is the “Cook Cumulative Tick,” a proprietary measure he created in 1986 that uses the NYSE Tick in conjunction with stock prices. His indicator alerted him to the 1987, 2000, and 2007 crashes. The indicator also helped to identify the beginning of a bull market in the first quarter of April 2009, when the CCT unexpectedly went up, turning Cook into a bull. 

What does Cook see now? (more)

Please share this article

Macy’s, Inc. (NYSE: M)

Macy’s, Inc. operates stores and Internet Websites in the United States. Its stores and Websites sell a range of merchandise, including apparel and accessories for men, women, and children; cosmetics; home furnishings; and other consumer goods. The company also operates Bloomingdale’s Outlet stores that offer a range of apparel and accessories, including women’s ready-to-wear, fashion accessories, jewelry, handbags, and intimate apparel, as well as men’s, children’s, and women’s shoes. As of February 25, 2014, it operated approximately 840 stores under the Macy’s and Bloomingdale’s names in 45 states of the United States, the District of Columbia, Guam, and Puerto Rico, as well as the macys.com and bloomingdales.com Websites; and 13 Bloomingdale’s Outlet stores.
Take a look at the 1-year chart of Macy’s (NYSE: M) with my added notations:
1-year chart of Macy's (NYSE: M)
With the exception of a brief break in April, and another in May, M has been range bound since March. Over that period of time the stock has formed a clear resistance at $60 (red). In addition, the stock has also created a common level of support at $56 (blue), which had also been resistance prior. At some point the stock will have to break one of the two levels that the consolidation has created.

The Tale of the Tape: M has clear levels of support ($56) and resistance ($60). The possible long positions on the stock would be either on a pullback to $56, or on a breakout above $60. The ideal short opportunity would be on a break below $56.
Please share this article
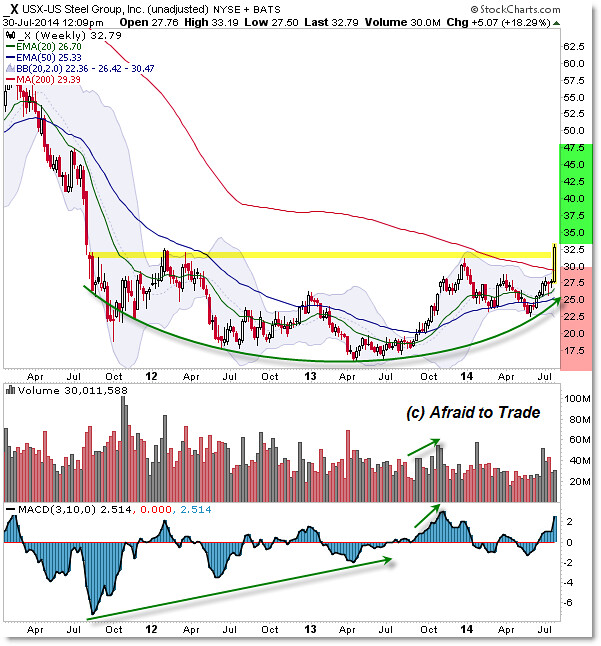
Breakout in US Steel: X

Is it possible that US Steel (X) is finally catching a bid from a breakout (and reversal pattern) from a long-term resistance level?
Could this be the start of a new long-term uptrend in price?
Let’s take a look at the Weekly and Monthly Chart to give us some clues for a longer-term play.

First, let’s start with the long-term “Rounded Reversal” or Saucer Reversal pattern that has developed since mid-2011 to present (mid-2014).  (more)
Please share this article

BRIC-Heavy ETFs At PE Ratios Below 9

With the SPDR S&P 500 ETF (SPY) and the Vanguard Total Stock Market ETF (VTI) currently trading at forward price earning multiples near 17, investors are regaining their appetite for emerging markets. A year after the taper tantrum smacked emerging markets, flows into the developing countries are picking up, lured in large part by the relative value proposition (and signs of easing in China). In a recent investment note that recommended emerging market stocks, BlackRock’s (BLK) chief global investment strategist cited improving liquidity -- six weeks of positive flows -- as a signal that sentiment is in shift mode.

The two largest emerging market ETFs, the $48 billion Vanguard Emerging Markets Stock Index ETF (VWO) and the $41 billion iShares MSCI Emerging Markets ETF (EEM) both trade at forward multiples below 12. That’s even after a strong rebound during the past six months following the global micro-swoon that started the year:(more)

Please share this article

Homebuilder Stocks Continue To Tank

Despite the “robustly” rigged GDP number, padded by a dubiously large attribution to construction and home improvement spending, the homebuilder stocks continue their huge sell-off, which started last week. I say that the GDP attribution for construction and home improvement spending is “dubious” because the numbers compiled, massaged and reported by the Government do not correlate with the reports being released by construction industry companies and industry associations or with home improvement/furnishings retailers.
Here’s a daily graph of the Dow Jones Home Construction Index:
Untitled
The homebuilders currently represent what I believe to be on the of the lowest risk/return short-sell plays in the market right now. Every single one I look at is borrowing $100′s of millions to build up what has become “bulging” home and land inventories.
Most of them will not make it through the next downleg of the housing bear market.
I have written my first research report on a homebuilder short-sell idea .  I believe this stock has an easy 60% return from where it trades now. You can access this report here:   My Research Reports.
Because of the large sudden drop in the homebuilder stocks over the last week, I would suggest reading my report and waiting for an oversold bounce before entering the short. However, you can also short near money calls that expire 3 or 4 months out to start a position now. The reason to do this is you get to hold the premium from shorting the call. If the stock keeps dropping, you can cover the call for a profit or hold it to expiration and keep the entire premium. If the stock moves above the call price by expiration, you let the call exercise and establish a short at an average price of the strike price PLUS the premium you collected from shorting the call.
Please share this article