Thursday, August 6, 2015

Walt Disney $DIS Stock Drops, What's Next?

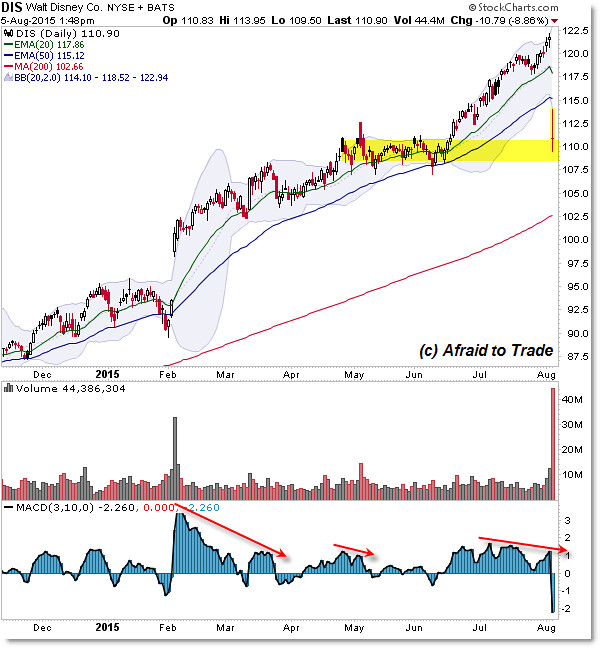
Not to be outdone by Apple’s (AAPL) big gap into support yesterday, strong trending stock Disney (DIS) disappointed investors and dropped straight into a key support reference level.
Let’s update our Disney (DIS) chart, learn a quick lesson, and plan the next move for this big stock.
We’ll start with the Daily Chart:

First, take a moment to review yesterday’s update on Apple which is similar to Disney (DIS) here.
Disney is (was) a strong trending stock that repeatedly showed up on our trending stock scans as the extended uptrend continued higher and higher.  (more)

Chart of the Day: Comfort Systems USA (FIX)‏

The Chart of the Day is Comfort Systems USA (FIX).  I found the heating and air conditioning products stock by using Barchart to sort the All Time High list for the stocks with the highest Weighted Alpha then used the Flipchart feature to review the charts.  Since the Trend Spotter signaled  a buy on 6/23 the stock gained 22.36%.

Comfort Systems USA, Inc. is a national provider of comprehensive heating, ventilation and air conditioning installation, maintenance, repair and replacement services. They operate primarily in the commercial and industrial HVAC markets, and perform most of their services within manufacturing plants, office buildings, retail centers, apartment complexes, and healthcare, education and government facilities.

Technical factors:
  • 100% Barchart technical buy signals
  • 110.70+ Weighted Alpha
  • Trend Spotter buy signal
  • Above its 20, 50 and 100 day moving averages
  • 11 new highs and up 24.22% in the last month
  • Relative Strength Index 79.76%
  • Barchart computes a technical support level at 27.07
  • Recently traded at 28.63 with a 50 day moving average of 23.66
Fundamental factors:
  • Market Cap $1.07 billion
  • P/E 31.06
  • Dividend yield .87%
  • Revenue expected to grow 11.90% this year and another 8.60% next year
  • Earnings estimated to increase 49.20% this year, an additional 41.50% next year and continue to increase at an annual rate of 15.65% for the next 5 years
  • Wall Street analysts issued 2 strong buy and 2 hold recommendations on the stock

CME Group Inc (NASDAQ: CME)

CME Group Inc., through its subsidiaries, operates contract markets for the trading of futures and options on futures contracts worldwide. It offers a range of products for trading and/or clearing across various asset classes, based on interest rates, equity indexes, foreign exchange, energy, agricultural commodities, and metals. The products include exchange-traded; and privately negotiated futures and options contracts and swaps. The company executes trades through its electronic trading platforms, open outcry, and privately negotiated transactions, as well as provides hosting, connectivity, and customer support for electronic trading through its co-location services. It also offers clearing and settlement services for exchange-traded contracts, as well as for cleared swaps; and regulatory reporting solutions for market participants through global repository services in the United States, the United Kingdom, and Canada.
Take a look at the 1-year chart of CME (NASDAQ: CME) below with my added notations:
1-year chart of CME (NASDAQ: CME)
CME has been trending higher over the past year, and along the way it has created a couple of levels to watch. First, the stock has formed a clear resistance at $100 (red), which would also be a 52-week high breakout if CME could manage to move above it. In addition, the stock is climbing an up-trending support level (blue) since October. These two levels combined have CME stuck within a common chart pattern known as an ascending triangle. Eventually, the stock will have to break one of those (2) levels.

The Tale of the Tape: CME has an up trending support and a 52-week resistance level to watch. A long trade could be made on a pullback to the support, or on a break above $100. A break below the up trending support could be an opportunity to enter a short trade.
A 40% Total Return with Kinder Morgan Inc (KMI) Stock?

Kinder Morgan Inc (KMI) — This owner of the general partners of Kinder Morgan Energy Partners and El Paso Pipeline Partners is one of the largest energy companies in the United States. Late last year, the company completed a plan to consolidate its three master-limited partnerships in a cash and stock deal totaling $71 billion.

Management said this was done to eliminate payments of incentive rights to KMI and give them the ability to generate dividends of $2 per share in 2015. They also believe they can grow the dividend by 10% to $2.20 through 2020.  (more)