The US Dollar Index hit a low in 1995, a high in 2002, a low in 2008, and a recent high in 2015. Examine the following 20 year chart of the dollar.
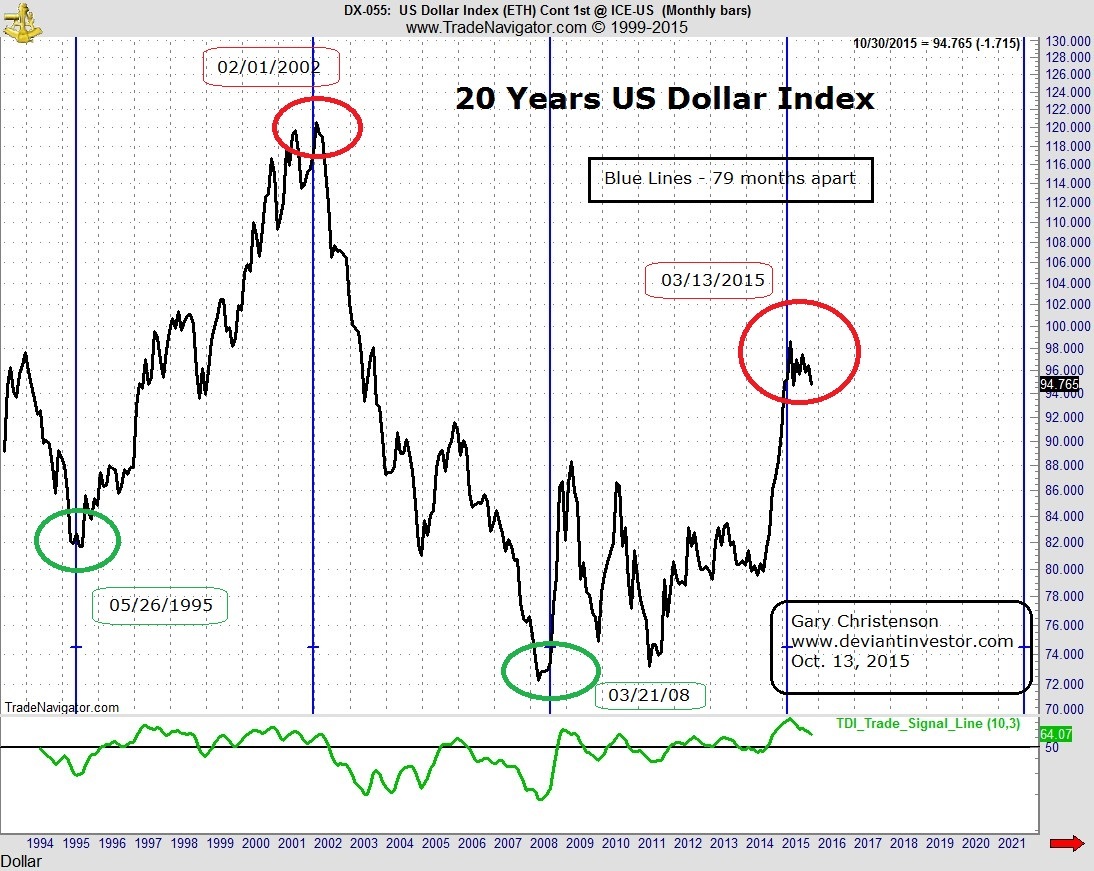
Note that the vertical blue lines are 79 months apart and show approximate low, high, low, and high cycle extremes. I have noted the dates for the weekly low and high closes near the green and red circles. (more)
No comments:
Post a Comment