Wednesday, July 29, 2015

DeVry Education Group Inc (NYSE: DV)

DeVry Education Group Inc. provides educational services worldwide. It operates in three segments: Medical and Healthcare; International and Professional Educational; and Business, Technology and Management. The Medical and Healthcare segment operates American University of the Caribbean School of Medicine, Ross University School of Medicine, Ross University School of Veterinary Medicine, Chamberlain College of Nursing, and Carrington College. The International and Professional Education segment operates various institutions comprising Fanor, Ruy Barbosa, ‘REA1, Faculdade Boa Viagem, Centro Universit’rio Vale do Ipojuca, Faculdade Diferencial Integral, Faculdade DeVry Sao Luis, and Faculdade DeVry Joao Pessoa, which primarily offers undergraduate and graduate programs in business, management, medical, healthcare, law, and engineeringThe Business, Technology and Management segment offers career-oriented masters, bachelors, and associate degree programs in technology, science, business, and the arts.
Take a look at the 1-year chart of DeVry (NYSE: DV) with the added notations:
1-year chart of DeVry (NYSE: DV)
DV has been trending lower since its December peak near $50, but the stock finally found some support towards the end of April. Since that low the stock has been holding a 52-week low support at $30. A break of that level would most likely lead to much lower prices for the stock.

The Tale of the Tape: DV has a key level of support at $30. A trader could enter a long position at $30 with a stop placed under the level. If the stock were to break below the support a short position could be entered instead.

Are Semiconducters $SOX A Buy?

From a more structural perspective Semiconductors have been a space we’ve wanted to stay away from for most of the year. Every time the sector index made new highs, it quickly failed. This along with consistent bearish momentum divergences on multiple time frames over the past year have kept us in the cautious camp and we’ve preferred to look elsewhere for long positions.
Looking at the PHLX Semiconductor Index, prices today are exactly where they were a year ago. This is essentially a basket of chip makers including the likes of Qualcomm, Texas Instruments, Intel, Broadcom, etc. The first chart shows the weekly candlesticks coming down to former resistance from last year (shaded in gray) that also served as support earlier this year. Notice how we are also right at this uptrend line from where this rally first got going in the second half of 2012.


With momentum putting in lower highs over the past year while prices rallied and then failed after each new high, we’ve been gun-shy on the long side. Looking at it today, RSI has held near the 40 level without getting oversold. That’s a good thing. If prices can hold onto this support and can prove it can stay above this uptrend line, I think that structurally this would be very positive.
Here is a closer look at the Semiconductor Index. Notice the bullish momentum divergence as RSI put in a higher low while prices made new lows over the past week:


The way I see it, there is a ton of potential here if prices can hang on to these levels. We only want to be long semi’s if prices are above this uptrend line. If prices cannot get/stay above it, then I do not see any reason to be involved on the long side. The levels are very well defined, which is what we want.
We can have potentially 75 points to the upside in this Index, but again, we would only want to be long if we can get above and stay above this uptrend line. If that doesn’t occur, then this is a moot point. Either way, the level is clear and I believe it’s well worth watching.

Other Commodities are Doing Far Worse Than Gold

Macro Man has been thinking a bit more about commodities recently, and before addressing the upcoming Fed meeting in another post later this week, he thought it would be useful to follow the line of thought.
Commodities generally, and gold in particular, have been in the headlines recently given their sharp price decline.  Some, indeed many, commenters have expressed the idea that gold is oversold, below its equilibrium level, due for a bounce, etc.    While short-term momentum indicators have certainly reached oversold levels (and are exhibiting a bit of positive divergence), Macro Man thought it would be useful to put the recent price decline in a longer-term perspective. (more)

Tuesday, July 28, 2015

Traders Should Watch this Level in Netflix NFLX

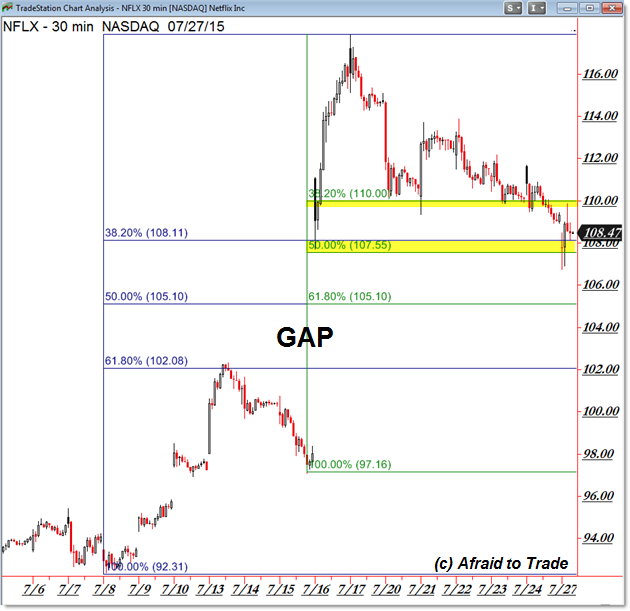
After a price surge and gap higher, Netflix (NFLX) shares are retracing in an ongoing uptrend.
For traders, there’s a clear price level to watch for clues to the future action – and opportunities.
Let’s pinpoint this level and update our price targets for Netflix (NFLX):

We’re seeing the 30-min Intraday Chart above with two key Fibonacci Retracement Grids drawn for you.
The first grid begins with the $92.30 per share swing low from July while the second grid is the bottom of the gap.
Both grids are drawn to the $117.00 level which was the “gap and run” spike high on July 16th.
Let’s first focus on the tighter 38.2% Level of the gap – it is $110.00 per share exactly. (more)

High Yield Breakdown

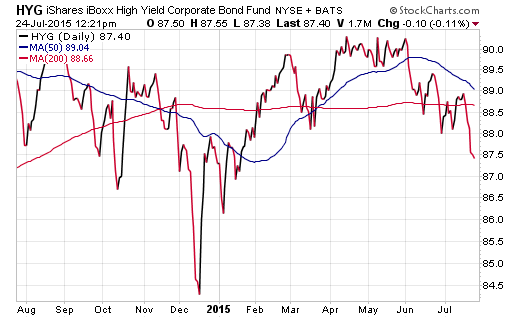
Could the high yield bond market be sending a precursor message to the Fed, signaling them not raise rates until 2016?
While that’s a notable possibility, the market just doesn’t seem hungry enough to gobble up excess inventory from record outstanding high yield debt levels.  Especially with intermediate to long-term fundamental challenges such as the imminent probability of a short-term interest rate hike and a barbell shaped rollover calendar centered in the 2019-2020 time frame.
These key convergences, alongside a spotty risk asset environment, have caused a breakdown from the established 2015 trading range in both the iShares High Yield Bond ETF (HYG) and SPDR High Yield Corporate Bond ETF (JNK).  Nevertheless, investors should take note that defaults have not meaningfully ticked higher and junk bonds are basically flashing the same warning signs as equities.  All the while, the credit markets feel sluggish and opportunities viewed through the lens of risk aversion seem sparse.
HYG
Looking at a total return attribution, with most high yield bond indexes yielding between 5-6%, investors have experienced slowly eroding bond prices with merely the income to keep them near the flat line for the year. (more)

Brunswick Corporation (NYSE: BC)

Brunswick Corporation designs, manufactures, and markets recreation products in the United States and internationally. The company’s Marine Engine segment offers outboard engines, sterndrive propulsion systems, and inboard engines under the Mercury, Mercury MerCruiser, Mariner, Mercury Racing, Mercury Sport Jet and Mercury Jet Drive, MotorGuide, Axius, and Zeus brands; and marine electronics and control integration systems, steering systems, instruments, controls, propellers, trolling motors, fuel systems, service parts, and marine lubricants under the Quicksilver, Mercury Precision Parts, Mercury Propellers, Attwood, Land N Sea, Kellogg Marine Supply, Diversified Marine Products, Bell Recreational Products, Sea Choice, and MotorGuide brands, as well as supplies integrated diesel propulsion systems.
Take a look at the 1-year chart of Brunswick (NYSE: BC) with the added notations:
1-year chart of Brunswick (NYSE: BC)
BC has been trading sideways for all of 2015. Along the way, the stock has found support at $50 (green) several times. Now that the stock appears to be falling back down to that support level again, traders could expect some sort of bounce. However, if the $50 support were to break, lower prices should follow.

The Tale of the Tape: BC has an important level of support at $50. A trader could enter a long position at $50 with a stop placed under the level. If the stock were to break below the support a short position could be entered instead.

Ross Clark – Capitulation of Miners. Marin Katusa – Energy. John Kaiser – Junior Miners.