from KingWorldNews:
Jeffrey Saut’s note regarding the carnage in the gold market:
Yesterday, however, I got some really interesting questions. One came
from a portfolio manager who wanted to know, “Have you heard any chatter
regarding margin calls within gold and or the gold miner sector?” Given
the carnage in the gold space, it is certainly a question to ponder. In
my view, gold entered a bear market in 2012, but the recent Gold
Gotcha’ began in earnest last June when the Chinese stock market lost
about one-third of its value.
As it turns out, Chinese brokerage firms were allowing gold to be
used as collateral in margin accounts for participants to buy Chinese
stocks. When the Chinese stock market started to melt down, not only
were stocks liquidated, but so was gold. That exacerbated the decline in
gold prices around the world with a concurrent “hit” to the gold mining
stocks. As a sidebar, a 50% retracement of gold’s entire 2001-2011
rally comes in at $1088 per ounce.
Jeffrey Saut Continues @ KingWorldNews.com
Friday, July 31, 2015
Gold $GLD, Bonds $TLT & Apple $AAPL
The gold market right now is trending lower and I think we are heading towards $1000. We also discussed bonds how we are approaching an important area of overhead supply. Then finally we finish up with Apple and how it’s been dead money for 5 months. I would continue to let it resolve before bothering with it.
Buy Facebook FB at Support Levels
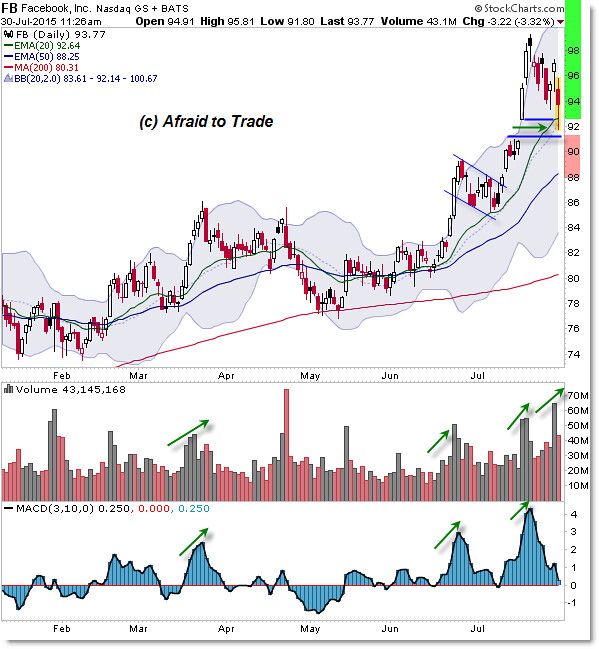
Is this the spot to buy Facebook (FB) shares?
Let’s update our daily chart levels, note a key confluence, and plan trades from the current swing.
Facebook (FB) shares are trending higher as evidenced by price (higher highs and higher lows) and a rising moving average slope.
Following the trend, we tend to look for retracements (like flags) or breakouts to buy shares into a rising trend. (more)
Thursday, July 30, 2015
Excessive Negative Sentiment in Gold and Canadian Dollar
Jason Goepfert at SentimenTrader notes the astonishing sentiment reading in the gold market: "The
latest Optimism Index readings for currencies and commodities showed
that gold is still the most-hated contract. Its Optix of 12 was
unchanged. It was slightly eclipsed in June 2013 otherwise this is the
lowest sentiment for gold since December 1997. (more)
Hershey (NYSE: HSY): Time To Buy?
As commodities in general remain weak, it was interesting to find cocoa
of all things ending a rebound with a downside trend break. While I
cannot offer statistically sound proof that companies using cocoa as an
input, namely chocolate makers, perform better as the commodity falls it
certainly could not hurt.
What I see now in Hershey (NYSE: HSY) is an upside trend break that occurred three days after the breakdown in cocoa. And I see a chance for traders to pick up a double-digit profit over the next few weeks.
Hershey is indeed a member of the consumer staples group, where companies' fortunes are not closely tied to the ups and downs of the economy. People will continue to buy products such as soap, cigarettes, makeup and food, even chocolate. Some may argue that the more nervous people get about their portfolios the more chocolate they might consume, but I digress.
HSY bounced off long-term support last month only days after announcing job cuts and a lower sales outlook on June 19. The price decline that day was sizeable and volume was exceptionally high to suggest some sort of selling climax and capitulation by the bulls. Even though prices drifted a bit lower, selling pressure was all but gone. Theoretically, everyone who wanted to sell had finally done so.
The vacuum of supply after a six-month downdraft left the stock exhausted. Cautious bulls nibbled and were not opposed. Then after rising to meet the January trendline, HSY punched through.
Conservative traders might wait for an inverted head-and-shoulders pattern to complete, but I believe the trend break following the rejection of bad news is enough to justify being early.
The first resistance exists at $96.50, near the May high and November breakout zone. The next resistance is in the $102.75 area, the top of the March-to-April trading range and the bottom of the December dip.
What is even more interesting is that both of these levels are approximate Fibonacci retracements of the 2015 decline. They are not exact, but they are close enough to demand respect.
Somewhere in the middle is the 200-day moving average, which I find useful as a trend gauge and not as a specific support or resistance level. Right now that average is flat and has been for the past year. As such, I would expect any rebound to overshoot it, and that is why I favor the higher resistance level as my price target here.
Recommended Trade Setup:
-- Buy HSY at the market price
-- Set stop-loss at $89
-- Set initial price target at $102.75 for a potential 12% gain in eight weeks
Speculators Could Land 25%-Plus With Alexion Pharmaceuticals $ALXN Stock
Alexion Pharmaceuticals, Inc. (ALXN)
— This biotechnology company develops special antibody therapeutic
products that target rare and severe diseases, including autoimmune
disorders, inflammation and cancer.
Its flagship drug Soliris is currently approved to treat a rare genetic blood disorder. Alexion also developed asfotase alfa for treatment of patients with infantile- and juvenile-onset hypophosphatasia, which secured the FDA’s “Breakthrough Therapy” designation in 2013 and is likely to be approved in the United States later this year. Additionally, this innovative pharmaceutical developer is on the verge of several other breakthrough drugs.
JPMorgan Chase recently moved ALXN stock to an “overweight” rating, saying the company is “entering a data rich 12-24 months, which is [an] underappreciated point.”
Capital IQ rates ALXN stock a “buy” and expects sales of Soliris to increase 18.4% in 2015, following a 44% increase in 2014. Its analysts forecast operating earnings will increase 78% to $5.80 per share this year, with gross margins of about 91.5%. Their 12-month price target is $240, but at an estimated compounded annual growth rate of 26%, this could prove to be conservative.
Technically ALXN stock jumped from a low of about $157 in June to a high of $208.88 on Thursday, which approximately matches a high made in late 2014. The recent advance triggered a new golden cross, a long-term buy signal, as it moved higher along a short-term trendline and its 20-day moving average, now at $196.56.
ALXN stock is highly volatile, so under current market conditions it is likely that it can be bought at a much lower price. Therefore, my buy under price is $190. A stop-loss order should be entered at $175.
My trading target is $240, which could be achieved within three months. If so, ALXN stock would provide speculators with a return of more than 25%.
Adobe Systems Incorporated (NASDAQ: ADBE)
Adobe Systems Incorporated is a diversified software company
worldwide. It operates in three segments: Digital Media, Digital
Marketing, and Print and Publishing. The Digital Media segment provides
tools and solutions that enable individuals, small and medium
businesses, and enterprises to create, publish, promote, and monetize
their digital content. The Digital Marketing segment offers solutions
for how digital advertising and marketing are created, managed,
executed, measured, and optimized. The Print and Publishing segment
offers products and services, such as eLearning solutions, technical
document publishing, Web application development, and high-end printing,
as well as publishing needs of technical and business, and original
equipment manufacturers (OEMs) printing businesses. The company markets
and licenses its products and services directly to enterprise customers
through its sales force, as well as to end-users through app stores and
through its Website at adobe.com.
Take a look at the 1-year chart of Adobe (NASDAQ: ADBE) below with my added notations:
Over the last 10 months ADBE has slowly climbed higher. During that time the stock had also formed a nice trend line of support (blue). Always remember that any (2) points can start a trend line, but it’s the 3rd test and beyond that confirm its importance. ADBE’s trendline is very important. Earlier this week the stock broke that trendline, and now it currently sits on its key level of $80 (green).
The Tale of the Tape: ADBE has broken below trend line support, but still holds its key level of $80. A short position could be entered on a rally up to the trendline, which is currently near $81, with a stop placed above that level, or wait for a break below $80. A long position could be entered at $80, or if ADBE were to break back above the trendline.
Wednesday, July 29, 2015
DeVry Education Group Inc (NYSE: DV)
DeVry Education Group Inc. provides educational services worldwide.
It operates in three segments: Medical and Healthcare; International and
Professional Educational; and Business, Technology and Management. The
Medical and Healthcare segment operates American University of the
Caribbean School of Medicine, Ross University School of Medicine, Ross
University School of Veterinary Medicine, Chamberlain College of
Nursing, and Carrington College. The International and Professional
Education segment operates various institutions comprising Fanor, Ruy
Barbosa, ‘REA1, Faculdade Boa Viagem, Centro Universit’rio Vale do
Ipojuca, Faculdade Diferencial Integral, Faculdade DeVry Sao Luis, and
Faculdade DeVry Joao Pessoa, which primarily offers undergraduate and
graduate programs in business, management, medical, healthcare, law, and
engineeringThe Business, Technology and Management segment offers
career-oriented masters, bachelors, and associate degree programs in
technology, science, business, and the arts.
Take a look at the 1-year chart of DeVry (NYSE: DV) with the added notations:
DV has been trending lower since its December peak near $50, but the stock finally found some support towards the end of April. Since that low the stock has been holding a 52-week low support at $30. A break of that level would most likely lead to much lower prices for the stock.
The Tale of the Tape: DV has a key level of support at $30. A trader could enter a long position at $30 with a stop placed under the level. If the stock were to break below the support a short position could be entered instead.
Are Semiconducters $SOX A Buy?
From a more structural perspective Semiconductors have been a space
we’ve wanted to stay away from for most of the year. Every time the
sector index made new highs, it quickly failed. This along with
consistent bearish momentum divergences on multiple time frames over the
past year have kept us in the cautious camp and we’ve preferred to look
elsewhere for long positions.
Looking at the PHLX Semiconductor Index, prices today are exactly where they were a year ago. This is essentially a basket of chip makers including the likes of Qualcomm, Texas Instruments, Intel, Broadcom, etc. The first chart shows the weekly candlesticks coming down to former resistance from last year (shaded in gray) that also served as support earlier this year. Notice how we are also right at this uptrend line from where this rally first got going in the second half of 2012.
With momentum putting in lower highs over the past year while prices rallied and then failed after each new high, we’ve been gun-shy on the long side. Looking at it today, RSI has held near the 40 level without getting oversold. That’s a good thing. If prices can hold onto this support and can prove it can stay above this uptrend line, I think that structurally this would be very positive.
Here is a closer look at the Semiconductor Index. Notice the bullish momentum divergence as RSI put in a higher low while prices made new lows over the past week:
The way I see it, there is a ton of potential here if prices can hang on to these levels. We only want to be long semi’s if prices are above this uptrend line. If prices cannot get/stay above it, then I do not see any reason to be involved on the long side. The levels are very well defined, which is what we want.
We can have potentially 75 points to the upside in this Index, but again, we would only want to be long if we can get above and stay above this uptrend line. If that doesn’t occur, then this is a moot point. Either way, the level is clear and I believe it’s well worth watching.
Other Commodities are Doing Far Worse Than Gold
Macro Man has been thinking a bit more about commodities
recently, and before addressing the upcoming Fed meeting in another
post later this week, he thought it would be useful to follow the line
of thought.
Commodities generally, and gold in particular, have been in the headlines recently given their sharp price decline. Some, indeed many, commenters have expressed the idea that gold is oversold, below its equilibrium level, due for a bounce, etc. While short-term momentum indicators have certainly reached oversold levels (and are exhibiting a bit of positive divergence), Macro Man thought it would be useful to put the recent price decline in a longer-term perspective. (more)
Tuesday, July 28, 2015
Traders Should Watch this Level in Netflix NFLX
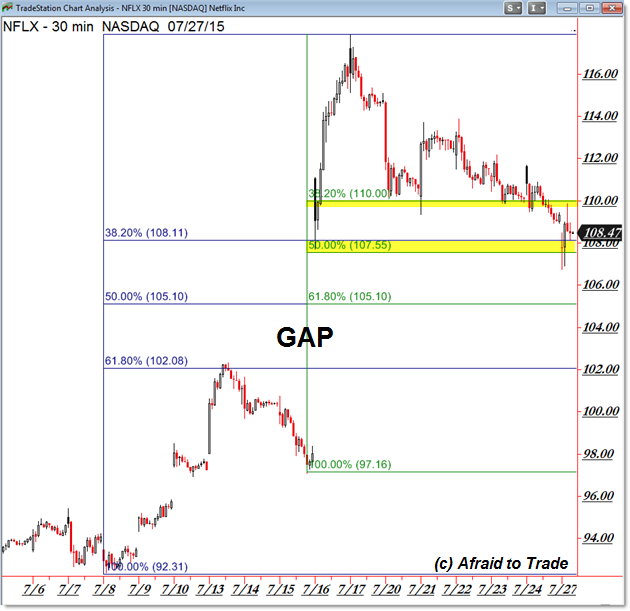
After a price surge and gap higher, Netflix (NFLX) shares are retracing in an ongoing uptrend.
For traders, there’s a clear price level to watch for clues to the future action – and opportunities.
Let’s pinpoint this level and update our price targets for Netflix (NFLX):
We’re seeing the 30-min Intraday Chart above with two key Fibonacci Retracement Grids drawn for you.
The first grid begins with the $92.30 per share swing low from July while the second grid is the bottom of the gap.
Both grids are drawn to the $117.00 level which was the “gap and run” spike high on July 16th.
Let’s first focus on the tighter 38.2% Level of the gap – it is $110.00 per share exactly. (more)
High Yield Breakdown
Could the high yield bond market be sending a precursor message to the Fed, signaling them not raise rates until 2016?
While that’s a notable possibility, the market just doesn’t seem hungry enough to gobble up excess inventory from record outstanding high yield debt levels. Especially with intermediate to long-term fundamental challenges such as the imminent probability of a short-term interest rate hike and a barbell shaped rollover calendar centered in the 2019-2020 time frame.
These key convergences, alongside a spotty risk asset environment, have caused a breakdown from the established 2015 trading range in both the iShares High Yield Bond ETF (HYG) and SPDR High Yield Corporate Bond ETF (JNK). Nevertheless, investors should take note that defaults have not meaningfully ticked higher and junk bonds are basically flashing the same warning signs as equities. All the while, the credit markets feel sluggish and opportunities viewed through the lens of risk aversion seem sparse.
Looking at a total return attribution, with most high yield bond indexes yielding between 5-6%, investors have experienced slowly eroding bond prices with merely the income to keep them near the flat line for the year. (more)
Brunswick Corporation (NYSE: BC)
Brunswick Corporation designs, manufactures, and markets recreation
products in the United States and internationally. The company’s Marine
Engine segment offers outboard engines, sterndrive propulsion systems,
and inboard engines under the Mercury, Mercury MerCruiser, Mariner,
Mercury Racing, Mercury Sport Jet and Mercury Jet Drive, MotorGuide,
Axius, and Zeus brands; and marine electronics and control integration
systems, steering systems, instruments, controls, propellers, trolling
motors, fuel systems, service parts, and marine lubricants under the
Quicksilver, Mercury Precision Parts, Mercury Propellers, Attwood, Land N
Sea, Kellogg Marine Supply, Diversified Marine Products, Bell
Recreational Products, Sea Choice, and MotorGuide brands, as well as
supplies integrated diesel propulsion systems.
Take a look at the 1-year chart of Brunswick (NYSE: BC) with the added notations:
BC has been trading sideways for all of 2015. Along the way, the stock has found support at $50 (green) several times. Now that the stock appears to be falling back down to that support level again, traders could expect some sort of bounce. However, if the $50 support were to break, lower prices should follow.
The Tale of the Tape: BC has an important level of support at $50. A trader could enter a long position at $50 with a stop placed under the level. If the stock were to break below the support a short position could be entered instead.
Monday, July 27, 2015
Stocks To Watch: HOTR, AMDA, CSTE, IAG, OHR
Chanticleer Holdings Inc (NASDAQ:HOTR) Thin name. Will it break up this resistant level? It is showing a small bullish flag just under the 50-day EMA with a 2.73 buy point. With good trading volume, the stock could be poised to trade higher to test its next level of resistence around 3.15.
Amedica Corporation (NASDAQ:AMDA) broke out of a symmetrical triangle chart pattern to the upside on Friday, which is very bullish. Watch for a good follow through day. First target is the 88c area, and beyond that the 1.10 area. Stop 64c
Caesarstone Sdot-Yam Ltd (NASDAQ:CSTE) is flagging just above the 66 breakout area after a steep rise from the 55 level in April. A break of this Bullish pattern could move the stock to test its all-time high just above the $70 level.
On Friday, IAMGOLD Corp (NYSE:IAG) formed a reversal candlestick. Most probably, this technical rebound will push the price up to 1.70 area (previous support, now resistance).
OHR Pharmaceutical Inc (NASDAQ:OHRP) I will keep my long position intact. On the technical side, the stock has been pulling back on low volume to test the breakout zone around the 2.9-3 area. If this zone is respected next week, I expect that the next rebound will push price up to $5. Money flow has been very solid over the past days and the accumulation/distribution continues to be bullish, we just might be on our way to higher prices IMHO.
Yandex NV (NASDAQ: YNDX)
Yandex N.V. operates an Internet search engine in Russia and
internationally. The company offers search, location-based,
personalized, and mobile services that enable users to find information,
and communicate and connect over the Internet from desktops and mobile
devices; and localized homepages for specific geographic markets. It
provides Yandex.News, a news aggregation and information service;
Kinopoisk.ru, a Russian language Website for movies, television
programs, and celebrities; Yandex.Music, a music streaming service;
Yandex.Master, a service through which users can find local
professionals to do work around their homes; Auto.ru, an
automobile-related Website; and other specialized search services for
images, video, music, television, weather, jobs, transportation, cars,
and real estate. Yandex N.V. was incorporated in 2004 and is based in
Amsterdam, the Netherlands.
Take a look at the 1-year chart of Yandex (NASDAQ: YNDX) below with my added notations:
YNDX has been in a persistent downward move for the past 3 months. Over that time, the stock has formed a trend line of resistance (red). Any (2) points can start a trend line, but it’s the 3rd test and beyond that confirm its importance.
YNDX has tested its trendline 3 times, so far, and that line currently sits right around $15. Assuming the stock continues to fall, it should be on its way down to the $14 support (green).
The Tale of the Tape: YNDX is currently stuck under a down trending resistance. A break above that resistance should mean higher prices, thus a long trade could be made either then, or on a fall to the $14 support. Short traders might look to enter a trade at the resistance or on a break of $14.
Tom Arnott: Legend Who Oversees $175 Billion Warns Global Ponzi Scheme Now Showing Signs Of Coming Unraveled
kingworldnews.com / July 26, 2015
On the heels of more weak economic data releases from the United States, a legendary chairman & CEO overseeing more than $175 billion, who is one of the most respected men in the financial world, issued a major warning to the financial world.
Today legendary Robert Arnott (above), who oversees $175 billion, issued a warning to the financial world.
Rob Arnott: “Commodities have crashed. Emerging-market bonds have cratered. Emerging-market stocks have had a grinding 4 1/2-year bear market. TIPS are down. High-yield bonds are down. So pretty much everything outside of mainstream stocks is flat to down over the last 30 months.
READ MORE
US Weekly Economic Calendar
time (et) | report | period | ACTUAL | forecast | previous |
---|---|---|---|---|---|
MONDAY, JULY 27 | |||||
8:30 am | Durable goods orders | June | 2.6% | -2.2% | |
TUESDAY, JULY 28 | |||||
9 am | Case-Shiller home price index | May | -- | 0.3% | |
10 am | Consumer confidence index | July | 99.1 | 101.4 | |
WEDNESDAY, JULY 29 | |||||
10 am | Pending home sales | June | -- | 0.9% | |
2 pm | FOMC announcement | ||||
THURSDAY, JULY 30 | |||||
8:30 am | Weekly jobless claims | July 25 | N/A | N/A | |
8:30 am | GDP | Q2 | 2.5% | -0.2% | |
FRIDAY, JULY 31 | |||||
8:30 am | Employment cost index | Q2 | 0.6% | 0.7% | |
9:45 am | Chicago PMI | July | -- | 49.4 | |
10 am | Consumer sentiment index | July | -- | 93.3 | |
Saturday, July 25, 2015
The Next Financial Disaster Starts Here
Carl Icahn says this market is in a bubble… and that there’s “going to be a great run to the exits.”
Icahn is one of the world’s most successful investors. He’s worth $21.5 billion. According to Forbes, he’s the 31st richest person on the planet.
Last week, Icahn said that junk bonds are “extremely overheated.”
Junk bonds are usually issued by companies with shaky finances. They pay high interest rates to compensate investors for their high risk.
• Low interest rates have pushed investors into these risky bonds…
Junk bonds have become popular in recent years. They’re one of few places where investors have been able to get a decent income stream. (more)
This Has Never Happened To Gold Before
Friday, July 24, 2015
Quanta Services Inc (NYSE: PWR)
Quanta Services, Inc. provides specialty contracting services to the
electric power, and oil and gas industries in North America and
internationally. The company’s Electric Power Infrastructure Services
segment provides network solutions comprising design, installation,
upgrade, repair, and maintenance of electric power transmission and
distribution infrastructure, and substation facilities. The company’s
Oil and Gas Infrastructure Services segment provides network solutions
to customers involved in the development and transportation of natural
gas, oil, and other pipeline products. The company’s Fiber Optic
Licensing and Other segment designs, procures, constructs, maintains,
and owns fiber optic telecommunications infrastructure, as well as
licenses the right to use these point-to-point fiber optic
telecommunications facilities to its customers.
Take a look at the 1-year chart of Quanta (NYSE: PWR) with the added notations:
PWR chopped its way lower into the end of 2015, but the stock finally bottomed in December. Since leveling out a bit, PWR has found support near $27.50 (green) several times. Now that the stock appears to be falling back down to that support level again, traders could expect some sort of bounce. However, if the $27.50 support were to break, lower prices should follow.
The Tale of the Tape: PWR has an important level of support at $27.50. A trader could enter a long position at $27.50 with a stop placed under the level. If the stock were to break below the support a short position could be entered instead.
Sell Johnson Controls (NYSE: JCI)
This maker of automobile interior systems and building heating, cooling and
management systems broke down last month through its intermediate-term
trendline, as seen in the chart below.
That came on the heels of the June 10 breakout failure, also seen below, sparked by news the company was considering spinning off its automotive businesses. Initially the market viewed the spin-off as a positive for the company, but it was a one-day wonder rally. The next day, the stock started to fall, and it has not looked back since.
In the face of a series of lower highs and lower lows, the downside trend break and a drop back below the 200-day moving average, we can safely assume the bears are in charge here.
That suggests there is more downside ahead.
For some additional background, Johnson Controls is in the consumer discretionary sector and its representative exchange-traded fund, the Consumer Discretionary Select SPDR (NYSE: XLY), appears to be ready to turn lower.
This may surprise traders, as the fund recently broke out to the upside from its 2015 trading range. However, volume before, during and after the breakout was in serious decline, a textbook bearish warning.
With that in mind, let's look to see how low JCI can go. The weekly pattern in the chart is a somewhat choppy version of an inverse head-and-shoulders with small troughs surrounding a larger decline last October. Since the breakout failed, we can look for the entire pattern to be erased as the stock falls. That means a trip down to the $39 area from its current position above $46.
Of course, there may be counter-trend moves along the way as the stock trades within a short-term trend channel. But overall, the technicals support lower prices in a gradual move lower.
Recommended Trade Setup:
-- Short JCI at the market price
-- Set stop-loss at $49
-- Set price target at $39 for a potential 16% gain in eight weeks
Thursday, July 23, 2015
“Far Worse Than 1986″: The Oil Downturn Has No Parallel In Recorded History, Morgan Stanley Says
zerohedge.com / by Tyler Durden on 07/22/2015 16:31
On Tuesday the market got yet another reminder of just how painful the “current commodity price environment” has been for producers when Chesapeake eliminated its common dividend in order to conserve cash.
After noting the plunge in Chesapeake’s shares (to a 12-year low) we subsequently outlined why the US shale “revolution” is now running out of lifelines as hedges roll off and as the next round of credit line assessments looms in October.
A persistent theme here – as regular readers are no doubt aware – has been the extent to which an ultra-accommodative Fed has contributed to a deflationary supply glut by ensuring that beleaguered producers retain access to capital markets. In short, cash-strapped companies who would have otherwise gone out of business have been able to stay afloat thanks to the fact that Fed policy has herded investors into risk assets.
In a ZIRP world, there’s plenty of demand for new HY issuance and ill-fated secondaries, which means the digging, drilling, and pumping gets to continue indefinitely in what may end up being one of the most dramatic instances of malinvestment the market has ever seen.
READ MORE
Stocks To Watch: SCON, ESI, JUNO, PLUG
Superconductor Technologies, Inc.
(NASDAQ:SCON) has been under accumulation for a couple days now. Look at
the 3 big volume days. That's serious accumulation.The daily technical
chart shows a very bullish sign as the stock is back on top of 50 day
exp moving average. For now, expect a run up to next resistance area
around $1.65. If the stock is able to cross it and sustain above it,
then it might go to $1.73 ( 200EMA ). Support lies around $1.11.
Shares of ITT Educational Services, Inc. (NYSE:ESI) are starting to heat up and are worth watching. If volume can pick up I think this stock can break through resistance at $5.15 and re-test its recent highs around $6.62.
If Juno Therapeutics Inc (NASDAQ:JUNO) can break out above $55 with heavy volume, I think the stock could shoot up to test the $60 area. There looks to be good upside potential, so watch the stock very closely on Thursday.
Keep an eye on Plug Power Inc (NASDAQ:PLUG) and monitor its volume, MACD and RSI for any potential breakouts. If the stock can manage a close above its psychological resistance level at $2.52 (50EMA) on high volume, it would be a great buying opportunity. Over the past month, Plug Power Inc (NASDAQ:PLUG) saw its short interest decrease by 2%.
Spirit Airlines Incorporated (NASDAQ: SAVE)
Spirit Airlines, Inc. provides low-fare airline services. As of June
30, 2015, it operated approximately 360 daily flights to 57 destinations
in the United States, Caribbean, and Latin America. As of December 31,
2014, the company had a fleet of 65 Airbus single-aisle aircraft
comprising 29 A319s, 34 A320s, and 2 A321s.
Take a look at the 1-year chart of Spirit (NASDAQ: SAVE) below with my added notations:
SAVE has formed a key price level at $60 (red) over the last two months. In addition, the stock created a down trending resistance starting from the middle of May (green). These two lines combined had SAVE stuck trading within a common chart pattern known as a descending triangle. At some point, the stock had to break support or break its string of lower highs, and last week the stock broke support.
The Tale of the Tape: SAVE broke out of a descending triangle pattern. A short trade could be made on a rally up to $60 with a stop placed above that level. A break back through $60 would set up a potential long trade, and another long could be made on a break through the downtrending resistance.
Teucrium Corn Fund (CORN): It's Time to Take Profits on Our "Trade of the Year"
We're less than eight months into 2015. But our "trade of the year" is already paying off...
Last October, I said that 2015 could turn out to be the year of the corn trade. Since then, the price of corn has rallied around 25%.
Traders who took our advice to buy the Teucrium Corn Fund (CORN)
are sitting on solid profits. But now, it's time to take those gains off
the table... (more)
Wednesday, July 22, 2015
Where Are U.S. Treasury Bonds Heading From Here?
The obsession with when Interest Rates are going higher has been one
of the most fascinating things to watch as a market participant over the
past few years. Economists continue to tell us that rates are going
higher, but the market keeps suggesting, as it has for years now, that
rates are likely to stay down or even go lower.
Today we are looking at shares of $TLT that represent a liquid exchange traded fund that tracks U.S. Treasury Bonds, particularly the longer end of the curve. First we want a more structural perspective to see where we are bigger picture and then work our way down. Here is a weekly candlestick chart showing prices exploding higher throughout 2014 after Wall Street economists told us they would head lower. This year we have retraced exactly 61.8% of that move to find support near the 115 level. This is a standard retracement and a key support level that we want to watch. From a risk management perspective, I see no reason to be long if prices are below that support since June.
Looking at this tactically, we want to be adding to positions only if prices are above this downtrend line from the April highs and taking profits near 123 which served as support last December and this March. We have a key downtrend line from the 2015 highs and a flat 200 day moving average that suggest fading any strength into those levels.
Here is a short video describing what we are seeing here with a bit more detail:
A Bloodbath Worse than the 2008 Financial Crisis
from Casey Research
Commodities are getting crushed.
The Bloomberg Commodity Index (BCOM), which tracks 22 different commodities, just hit its lowest level since April 2002.
[...] Commodities as a group are now cheaper than they were during the financial crisis.
We told you yesterday that gold hit its lowest price in five and a half years. It’s just one of many commodities struggling right now. The price of coffee is down 27% so far this year… sugar and lumber prices are both down 22% this year… and a barrel of crude oil costs half of what it did a year ago.
Continue Reading at CaseyResearch.com…
WPX Energy Inc (NYSE: WPX)
WPX Energy, Inc., an independent natural gas and oil exploration and
production company, engages in the exploitation and development of
unconventional properties in the United States. The company focuses on
exploiting natural gas reserves base and related natural gas liquids in
the Piceance Basin of the Rocky Mountain region, as well as developing
and growing oil positions in the Williston Basin in North Dakota and the
San Juan Basin in the southwestern United States. As of December 31,
2014, it had proved reserves of 4,360 billion cubic feet of gas
equivalent.
Take a look at the 1-year chart of WPX (NYSE: WPX) with the added notations:
After its steep decline towards the end of last year, WPX has been trading in an overall sideways move since the beginning of 2015. And during that time, the stock had also created an important level of support at $10 (red). Now that the stock has broken that support, lower prices should follow.
The Tale of the Tape: WPX broke a key level of support at $10. A trader could enter a short position on any rallies up to or near $10 with a stop placed above the level. If the stock were to break back above the $10 level, a long position might be entered instead.
Monday’s Panic Selling In The Gold Market Has Only Occurred 6 Times In History – Price Moves After Each Historic Panic Are Remarkable
After Monday's massive selling pressure in the gold market, today King World News is pleased to feature a piece from one of the greats in the business discussing the fact that Monday's panic selling in gold has only occurred 6 times in history. He also noted that movements in the gold price after each historic panic selloff were remarkably similar. (more)
Tuesday, July 21, 2015
GoPro Inc (NASDAQ:GPRO)
GoPro Inc (NASDAQ:GPRO) jumped 7.3%
today finishing the session near the highs of the day on high volume,
suggesting buyers are stepping in. The move puts this stock in high
probability of a breakout above key resistance in the 61.2 area. If the
stock breaks today's high, the momentum could move stock to the $70
area.
Sell Zynga Inc $ZNGA, Buy King Digital Entertainment PLC $KING?
Zynga (NASDAQ:ZNGA) and King Digital Entertainment (NYSE:KING) have been ships passing in the night through most of their publicly traded lives, and that didn't exactly change when Morgan Stanley initiated coverage of the two mobile gaming giants last week.
Analyst Dean Prissman started coverage of Sugar Crush Saga publisher King with a bullish "overweight" rating and an $18 price target. It's a call that represents 22% in upside for the stock from where it was when the Morgan Stanley note was published. Prissman is impressed by King's ability to cross-promote its games across its growing network of more than 350 million players, something that is validated by checking the charts of the highest grossing games. (more)
Gold Cracks Major Support in Asian Trade: Trader Dan Norcini
by Dan Norcini
Trader Dan
With all of the base metals breaking down, with silver breaking down, with platinum and palladium breaking down, I suppose it was just a matter of time before gold finally gave up the ghost and followed them lower.
[...] Major support at the $1130 level, a level from which gold bounced higher back in October of last year and which had not been tested subsequently, was tested this evening and found to be wanting.
The break of this major support caused a huge surge in volume as waves of downside sell stops were taken out and triggered causing an avalanche of panicked selling by longs and some new and aggressive shorting by large specs.
Continue Reading at TraderDan.com…
Energen Corp. (NYSE: EGN)
Energen Corporation, through its subsidiary Energen Resources
Corporation, explores for, develops, and produces oil, natural gas, and
natural gas liquids in the United States. As of December 31, 2014, the
company had approximately 372.7 million barrels of oil equivalent
reserves located in the Permian Basin in west Texas, and the San Juan
Basin in New Mexico and Colorado. Energen Corporation was founded in
1929 and is headquartered in Birmingham, Alabama.
Take a look at the 1-year chart of Energen (NYSE: EGN) with the added notations:
EGN has mostly trended higher since its October/December low. However, from January through July the stock has also created an important level of support at $60 (green). Expectations would be for a rally from here, but a break of the $60 would most likely mean a fall to the next level of support at $55 (red).
The Tale of the Tape: EGN has an important level of support at $60. A trader could enter a long position at $60 with a stop placed under the level. If the stock were to break below the support a short position could be entered instead with the expectation of a fall down to $55.
Monday, July 20, 2015
5 Health Care Stocks Ready for Breakouts: AKBA, CALA, GNMK, HWAY, OTIC
Calithera Biosciences
One clinical-stage biopharmaceutical player that's starting to move within range of triggering a near-term breakout trade is Calithera Biosciences (CALA), which focuses on discovering and developing small molecule drugs directed against tumor metabolism and tumor immunology targets for the treatment of cancer in the U.S. This stock has been slammed lower by the sellers over the last six months, with shares down huge by 61.9%.
If you take a look at the chart for Calithera Biosciences, you'll see that this stock has been downtrending badly for the last four months and change, with shares falling sharply lower from its high of $22 to its recent low of $6.60 a share. During that downtrend, this stock has been making mostly lower highs and lower lows, which is bearish technical price action. That said, shares of Calithera Biosciences have now started to stabilize over the last month, with shares moving between $6.60 on the downside and $7.54 on the upside. This stock has started to spike higher off that $6.60 low and it's now beginning to move within range of triggering a near-term breakout trade above the upper-end of its recent sideways trending chart pattern. (more)
Short Sellers Circle Shake Shack $SHAK, Fitbit $FIT, and Etsy $ETSY
A clutch of recent well-known initial public offerings have enjoyed
prolific starts to their stock market careers. But short sellers are not
so convinced the party will last.
Out of the U.S. IPOs over $100 million this year, Shake Shack Inc.SHAK +7.12%, Etsy Inc.ETSY +30.60% and Fitbit Inc.FIT -1.28% are among the top 15 most expensive to short, a good proxy for demand by investors, according to data from Markit.
The share price of Shake Shack, the U.S. burger chain that listed in early January, soared 119% on its first day of trading. The maker of the ShackMeister Dog became an early target of short sellers. However its share price remained strong into May and short sellers backed off a little.
Now they are back. Since mid-May, Shake Shack’s stock has slumped 45%, however it is still up 23% from its listing price. At present, 3.6% of its shares are on loan.
By comparison, the average stock out on loan in the S&P 500 (of which Shake Shack is not a component) is 2.5%, Markit says.
Of the major U.S. IPOs in 2015 Shake Shake is the most expensive firm to short sell, according to a Markit report. At present, short sellers are paying an annualized fee of 105% of the amount borrowed in order to short the stock, it says.
Etsy, the Brooklyn, N.Y.-based online marketplace for handmade and vintage goods
that listed in early April,
has been a steady target for short sellers. While the IPO soared 88%
after a day of trading, it has since fallen 44% and is flirting around its offer price of $16. In the days after the IPO, only 1% of shares were on loan. This has steadily risen to 8%, according to Markit.
Gil Luria, an analyst at Wedbush Securities LLC, currently has a “sell” recommendation on Etsy. He thinks that Etsy is overpriced, and that revenue and the margins will come down in part driven by competition with Amazon Handmade, a rival service.
Another IPO that popped was wearable technology brand Fitbit. Listing in June 17, the company rose 48% over its first day trading, and 80% over its first week. It is currently up 139% from its offer price.
Analysts like the stock. Stifel Nicolaus, SunTrust Robinson Humphrey and Deutsche Bank AG have all nailed on “buy” ratings on the San Francisco-based company. However, shares on loan have risen to 3.7%, up from 2% in the days after listing.
Jim Duffy, an analyst at Stifel, has a “buy” recommendation on Fitbit. However, he says that part of the reason for the increase in short-selling interest could be that share prices have risen too high due to the short supply of growth venture companies and tech companies coming to market.
Etsy and Shake Shack declined to comment. Fitbit did not reply for comment.
Out of the U.S. IPOs over $100 million this year, Shake Shack Inc.SHAK +7.12%, Etsy Inc.ETSY +30.60% and Fitbit Inc.FIT -1.28% are among the top 15 most expensive to short, a good proxy for demand by investors, according to data from Markit.
The share price of Shake Shack, the U.S. burger chain that listed in early January, soared 119% on its first day of trading. The maker of the ShackMeister Dog became an early target of short sellers. However its share price remained strong into May and short sellers backed off a little.
Now they are back. Since mid-May, Shake Shack’s stock has slumped 45%, however it is still up 23% from its listing price. At present, 3.6% of its shares are on loan.
By comparison, the average stock out on loan in the S&P 500 (of which Shake Shack is not a component) is 2.5%, Markit says.
Of the major U.S. IPOs in 2015 Shake Shake is the most expensive firm to short sell, according to a Markit report. At present, short sellers are paying an annualized fee of 105% of the amount borrowed in order to short the stock, it says.
Gil Luria, an analyst at Wedbush Securities LLC, currently has a “sell” recommendation on Etsy. He thinks that Etsy is overpriced, and that revenue and the margins will come down in part driven by competition with Amazon Handmade, a rival service.
Another IPO that popped was wearable technology brand Fitbit. Listing in June 17, the company rose 48% over its first day trading, and 80% over its first week. It is currently up 139% from its offer price.
Analysts like the stock. Stifel Nicolaus, SunTrust Robinson Humphrey and Deutsche Bank AG have all nailed on “buy” ratings on the San Francisco-based company. However, shares on loan have risen to 3.7%, up from 2% in the days after listing.
Jim Duffy, an analyst at Stifel, has a “buy” recommendation on Fitbit. However, he says that part of the reason for the increase in short-selling interest could be that share prices have risen too high due to the short supply of growth venture companies and tech companies coming to market.
Etsy and Shake Shack declined to comment. Fitbit did not reply for comment.
Gold Stocks To Continue the Plummet?
As long as there are people who still believe that the gold market is uniquely manipulated rather than simply in sync with the world economy, then the sad truth remains that we have not yet seen the bottom of the slide in gold prices just yet. Gold’s weakness led to a brutal sell-off among the world’s top gold miners and our Energy Models warn we are STILL not yet in an oversold position.
On Friday, more than 22 million shares of Barrick changed hands as the price plummeted some 5% to the lowest seen since 1990. Gold has no friends left, only believers as the price collapsed to the lowest level since April 2010 after the Fed said the world’s largest economy favors a rate hike counter-trend to Europe before year-end which has strengthened the dollar. This was augmented by China announcing it has diversified its foreign reserves placing only 1.6% in gold – a number that took the wind out of the gold conspiracy that China would back its currency with gold.
The gold market has turned increasingly bearish with the once large gold futures investors such as hedge funds slashing long positions. The holding of such funds has collapsed falling below 1 million ounces reaching new nine year lows. As European austerity becomes widely seen as just insanity, the big money is starting to see the writing on the wall – buy dollars.
The sell-off in gold was led by Barrick Gold Corp (NYSE:ABX, TSE:ABX), which is the world’s leading producer as its shares fell 5% to the lowest in USD terms since 1990. Barrick’s market value is now down 32% over the last three months alone bringing its market-cap to just under $14 billion in New York down from $64 billion at its peak in 2011. Barrick’s gold production is expected to fall further as it faces an oppressive debt-load of more than $13 billion – an amount equal now to nearly the total value of shares. This warns that a rate hike may see the value of Barric collapse even further.
Denver-based Newmont mines is actually the only gold company that forms part of the S&P500 index and is the second largest producer fell just under 3% on Friday. ADRs of AngloGold Ashanti (NYSE:AU), the world’s third largest gold producer in terms of output fell 5.8% for a market value of $3.1 billion on the NYSE.
US Weekly Economic Calendar
time (et) | report | period | ACTUAL | forecast | previous |
---|---|---|---|---|---|
MONDAY, JULY 20 | |||||
None scheduled | |||||
TUESDAY, JULY 21 | |||||
None scheduled | |||||
WEDNESDAY, JULY 22 | |||||
9 a.m. | FHFA home price index | May | -- | 0.3% | |
10 a.m. | Existing home sales | June | 5.42 mln | 5.35 mln | |
THURSDAY, JULY 23 | |||||
8:30 am | Weekly jobless claims | July 18 | 284,000 | 281,000 | |
FRIDAY, JULY 24 | |||||
9:45 a.m. | Flash manufacturing PMI | July | -- | 53.6 | |
10 a.m. | New home sales | June | 550,000 | 546,000 | |
Saturday, July 18, 2015
Where is Support for Precious Metals Markets?
by Jordan Roy-Byrne, CMT
The Daily Gold
The gold miners have broken below their 2008 to 2014 support while Silver is essentially trading at a six year low. Gold looks set to make a new monthly low and weekly low but has yet to break its daily low at $1140/oz. Barring a sudden short squeeze Gold could be hours or days away from cracking in the way Silver and the miners have in recent weeks. The trend for the sector is obviously down and sentiment is following. However, the more important issue for long term bulls is where is the strong support for these markets.
The monthly candle charts of Silver and Gold are below. I’ll start with Silver. It is losing key support at $15/oz. The next key support levels are in the low $13s and low $12s. Moving to Gold, note that Gold appears to have lost $1180/oz which has been a key support level for two years. The monthly chart shows that the next strong support levels are $1040 and $1000.
Continue Reading at TheDailyGold.com…
Subscribe to:
Posts (Atom)