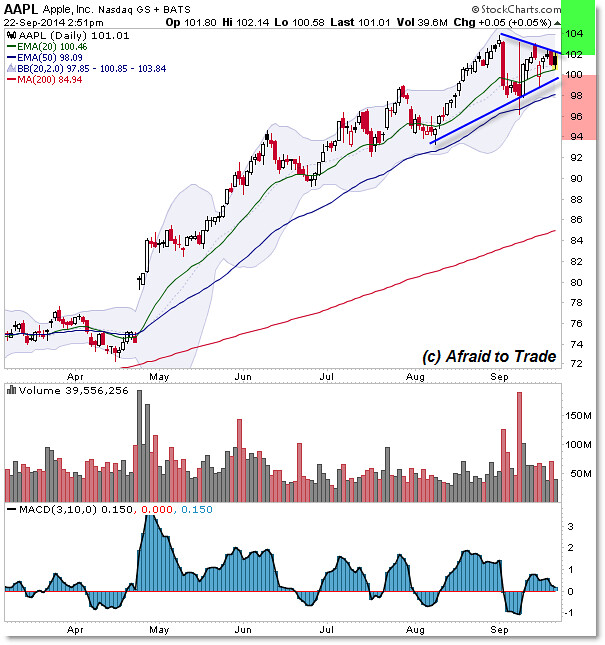
Let’s take a look at the Classic Chart pattern, note the boundaries, and trading tactics we may use as this pattern develops.

Shares continue a strong bullish uptrend as evidenced by higher price highs and higher price lows.
We also observe the most bullish orientation possible in the moving average structure of price in the trend. (more)
Please share this article
No comments:
Post a Comment