Today we are going to focus on the daily bar chart of $EEM which is the iShares ETF that represents the MSCI Emerging Markets Index. This Index has heavy exposure in China (17%), South Korea (15%) and the rest in places like Taiwan (12%), Brazil (10%), South Africa (7%), India (6%), Russia (5%), Mexico (4%), etc.
Take a look at the failed breakout earlier this month. This is just another one of the million examples of the fast moves that come from failed moves. The problem that I see here is that not only are we entering the week breaking the uptrend line from the 2014 lows, but also key support from the lows in June and August:
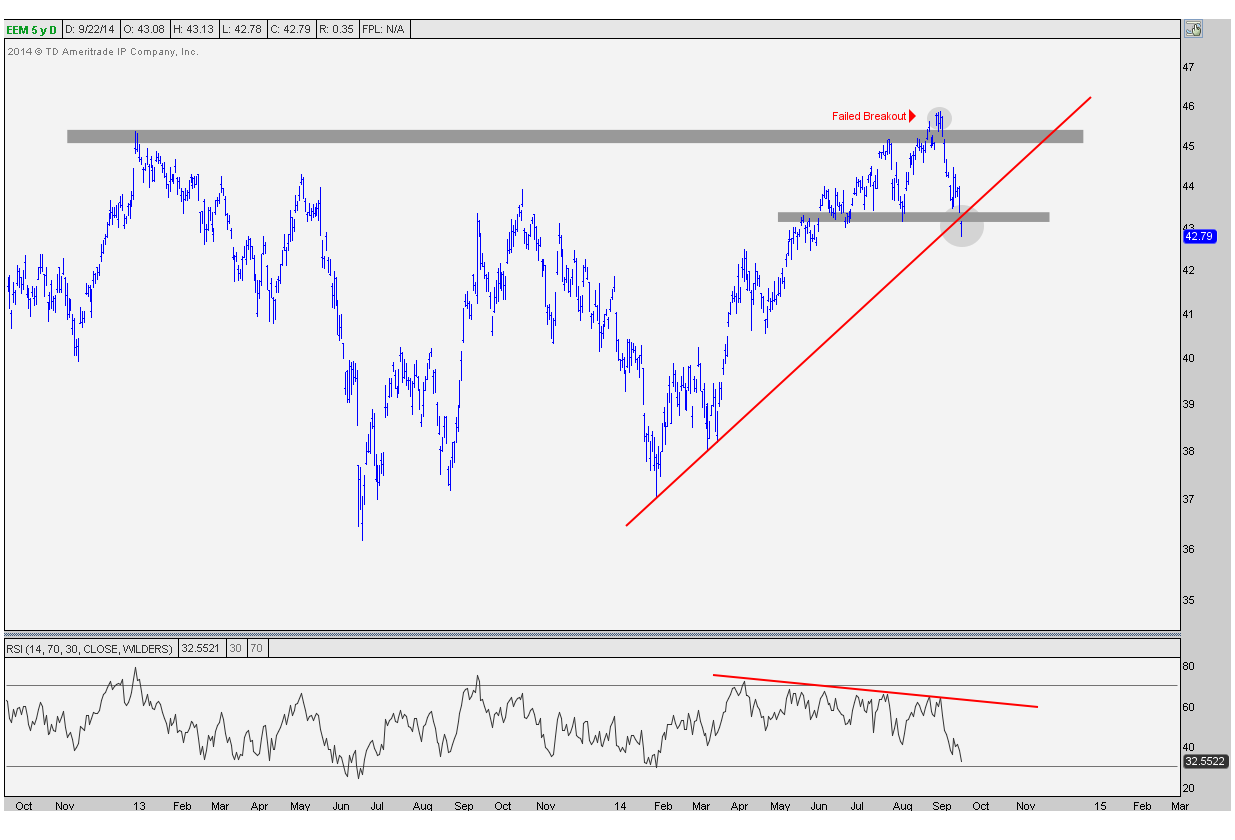
Notice the bearish divergence in momentum as RSI failed to confirm any of the new highs in price throughout the summer. Momentum was warning us of a problem, and prices now seem to be confirming. I would say that to invalidate any of this negative action, I would want to see prices rally back above 43.50 without RSI reaching oversold conditions. But other than that, it looks like lower prices are coming. (more)
Please share this article
No comments:
Post a Comment