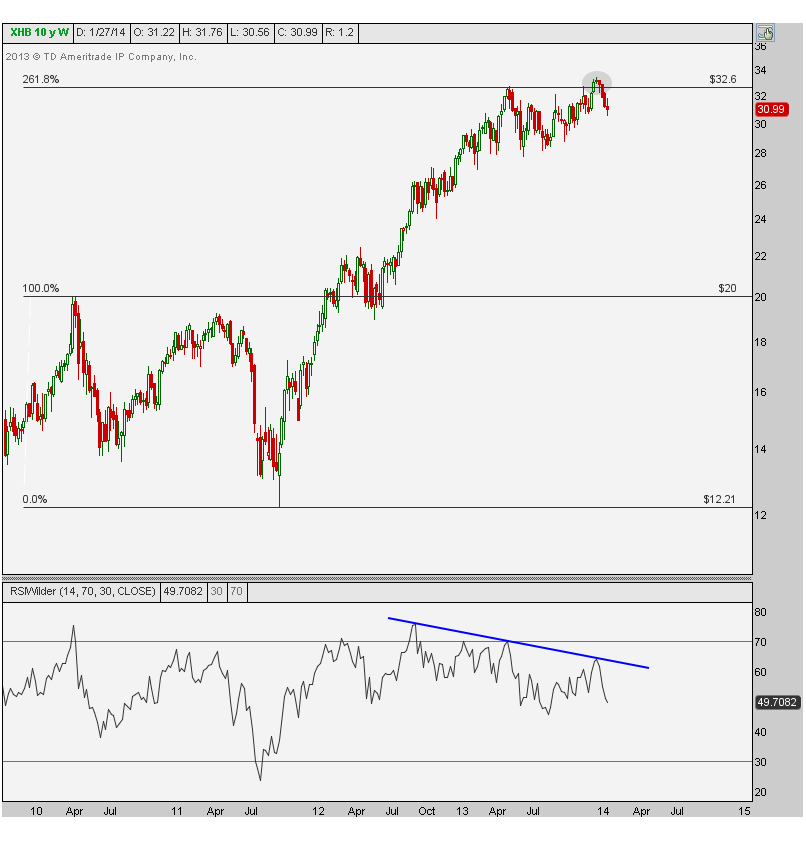
The first chart shows weekly candlesticks for the SPDR S&P Homebuilders ETF. You’ll notice that prices stalled at exactly the 261.8% Fibonacci extension of the last real correction in this sector from 2010-2011. But to makes things worse, prices on the second go around temporarily exceeded that key Fibonacci extension and May highs. This false breakout is a big problem, especially as momentum confirmed a bearish divergence last month.
 The
next chart gives us a closer look at these developments over the last
year. From false moves come fast ones in the opposite direction. It
looks to me based on the weekly and daily charts that there is still a
long way down in this space. I’m a seller of any strength.
The
next chart gives us a closer look at these developments over the last
year. From false moves come fast ones in the opposite direction. It
looks to me based on the weekly and daily charts that there is still a
long way down in this space. I’m a seller of any strength.
No comments:
Post a Comment