While there haven’t been any S&P 500 100% gainers so far in 2014, the staff at BespokeInvest.com
still thinks it’s important to review the biggest winners and losers
and they also point out the key factor that traders should watch over
the remainder of the year.
The average S&P 500 (SPX) (SPY)
stock is up 5.89% year-to-date, and 65.4% of the index is in the black
for the year. Below is a list of the 40 best performing S&P 500
stocks, so far, this year.
As shown, there aren't any 100% gainers in the index through
Tuesday, and we're going to need to see some big gains over the next
three and a half months if the index is going to register any doubles this year. New Field Exploration (NFX) is currently the biggest winner in 2014 with a gain of 63.82%. Another energy company—Nabors (NBR)—ranks second with a gain of 58.09%. Under Armour (UA), Electronic Arts (EA), and Green Mountain (GMCR) round out the top five, all with YTD gains of more than 50%. (more)
Please share this article
Friday, August 15, 2014

Rising Interest Rates? Tell Me About Them!
The "No- Brainer" can't miss trade coming into the first of this year
was that interest rates were going to rise. 90 Days ago I shared that
bond prices were breaking out, discussed in the "Tell Me About Rising
Rates" post (see here).
One of the key reasons to establish a long bond position was due to this: Interest rates had the largest 18-month rally in the past 30-years, up 50% more than the seven largest rallies in the past 30-years!
MarketWatch reported earlier this year that 100% of economist predicted that rates would rise. Wonder how that prediction has worked out? Year to date, TLT is up twice as much as the S&P 500.
The chart above highlights that the yield on the 10-year note has been falling since the first of the year and is now on rising support. IF support breaks, the next key support line comes into play around 15% below current levels.
If yields break support, would they be sending a message about the strength of the global economy? What happens here at support I feel is important to more than just the bond market!
Please share this article
One of the key reasons to establish a long bond position was due to this: Interest rates had the largest 18-month rally in the past 30-years, up 50% more than the seven largest rallies in the past 30-years!
MarketWatch reported earlier this year that 100% of economist predicted that rates would rise. Wonder how that prediction has worked out? Year to date, TLT is up twice as much as the S&P 500.
The chart above highlights that the yield on the 10-year note has been falling since the first of the year and is now on rising support. IF support breaks, the next key support line comes into play around 15% below current levels.

If yields break support, would they be sending a message about the strength of the global economy? What happens here at support I feel is important to more than just the bond market!
Please share this article
EXACT Sciences Corporation (NASDAQ: EXAS)
Exact Sciences Corporation, a molecular diagnostics company, focuses
on developing diagnostic screening products for the early detection and
prevention of colorectal pre-cancer and cancer. The company develops the
Cologuard, a non-invasive stool-based DNA colorectal cancer-screening
test that is designed to detect pre-cancerous lesions or polyps, and
each of the four stages of colorectal cancer. Its Cologuard test
includes proprietary and patented methods that isolate and analyze the
human DNA that are shed into stool every day from the exfoliation of
cells that line the colon; and also protein marker to detect blood in
the stool, utilizing an antibody-based fecal immunochemical test. The
company’s stool-based DNA colorectal cancer screening technology also
focuses on the inflammatory bowel disease.
Take a look at the 1-year chart of Exact (Nasdaq: EXAS) below with added notations:

EXAS has essentially been trading sideways for the last 2 months, while forming a common pattern known as a rectangle. A minimum of (2) successful tests of the support and (2) successful tests of the resistance will give you the pattern. EXAS’ rectangle pattern has formed a $17.50 resistance (red) and a $15 support (blue). A break above $17.50 would also be a new 52-week high.
The Tale of the Tape: EXAS is trading within a rectangle pattern. The possible long positions on the stock would be either on a pullback to $15, or on a breakout above $17.50. The ideal short opportunity would be on a break below $15.
Please share this article
Take a look at the 1-year chart of Exact (Nasdaq: EXAS) below with added notations:
EXAS has essentially been trading sideways for the last 2 months, while forming a common pattern known as a rectangle. A minimum of (2) successful tests of the support and (2) successful tests of the resistance will give you the pattern. EXAS’ rectangle pattern has formed a $17.50 resistance (red) and a $15 support (blue). A break above $17.50 would also be a new 52-week high.
The Tale of the Tape: EXAS is trading within a rectangle pattern. The possible long positions on the stock would be either on a pullback to $15, or on a breakout above $17.50. The ideal short opportunity would be on a break below $15.
Please share this article
Dreamworks: DWA Is In The Dumps -- Time To Buy?
Every Friday, I scan the movie reviews to see if there is a new film I
want to go see. And every week, I fail to find anything that appeals to
me.
Many others must feel the same way, seeing as box office receipts are off sharply this year, making this a season of misery for film studios. And no studio is feeling the pain more than Dreamworks Animation SKG (NYSE: DWA), which has slid 25% since I panned the company's business model five months ago.
Shares had already been in freefall and are now off more than 40% this year.

Yet with much of the bad news now priced into the stock, Dreamworks deserves a fresh look. The company is making moves now that should yield solid rewards in a few years.
(more)
Please share this article
Many others must feel the same way, seeing as box office receipts are off sharply this year, making this a season of misery for film studios. And no studio is feeling the pain more than Dreamworks Animation SKG (NYSE: DWA), which has slid 25% since I panned the company's business model five months ago.
Shares had already been in freefall and are now off more than 40% this year.
Yet with much of the bad news now priced into the stock, Dreamworks deserves a fresh look. The company is making moves now that should yield solid rewards in a few years.
(more)
Please share this article
Eaton Vance Corp (NYSE: EV)
Eaton Vance Corp., through its subsidiaries, engages in the creation,
marketing, and management of investment funds in the United States. It
also provides investment management and counseling services to
institutions and individuals. Further, the company operates as an
adviser and distributor of investment companies and separate accounts.
As of October 31, 2004, the company provided investment advisory or
administration services to approximately 150 funds; approximately 1,300
separately managed individual and institutional accounts; and
participated in approximately 40 retail-managed account broker/dealer
programs. It markets and distributes shares of funds through a retail
network of national and regional broker/dealers, banks, insurance
companies, and financial planning firms.
Take a look at the 1-year chart of Eaton (NYSE: EV) with my added notations:

After its steep January drop, EV has been range bound since February. Over that period of time the stock has formed a clear resistance at $38.50 (red). In addition, the stock has also created a common level of support at $35 (green). At some point the stock will have to break one of the two levels the consolidation has created.
The Tale of the Tape: EV has clear levels of support ($35) and resistance ($38.50). The possible long positions on the stock would be either on a pullback to $35, or on a breakout above $38.50. The ideal short opportunity would be on a break below $35.
Please share this article
Take a look at the 1-year chart of Eaton (NYSE: EV) with my added notations:
After its steep January drop, EV has been range bound since February. Over that period of time the stock has formed a clear resistance at $38.50 (red). In addition, the stock has also created a common level of support at $35 (green). At some point the stock will have to break one of the two levels the consolidation has created.
The Tale of the Tape: EV has clear levels of support ($35) and resistance ($38.50). The possible long positions on the stock would be either on a pullback to $35, or on a breakout above $38.50. The ideal short opportunity would be on a break below $35.
Please share this article
Thursday, August 14, 2014
Is the the Breakout You’ve Been Waiting for in Coal? KOL
I’m seeing increased chatter about Coal stocks and ETF KOL regarding a potential breakout and larger reversal.
Let’s take a quick look at the Weekly and Daily Chart to highlight the key levels to watch, potential targets, and try to answer the question “Is this THE breakout?”
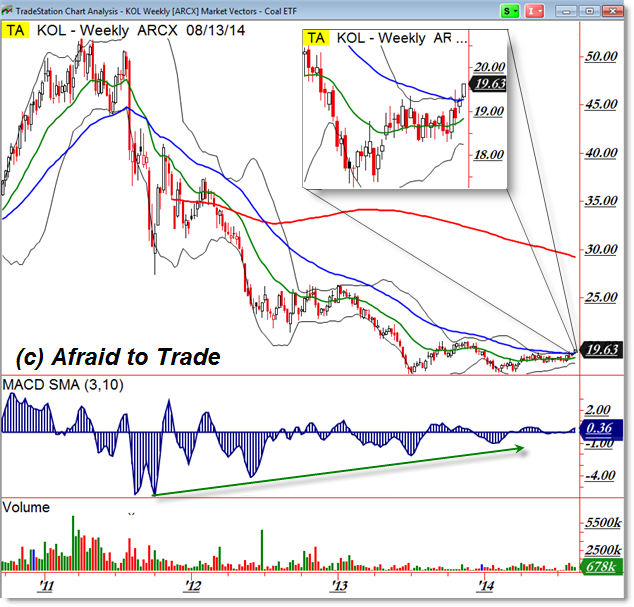
First, I’m showing a longer-term weekly chart of the coal ETF symbol KOL.
We can see a persistent and relentless DOWNTREND beginning in 2011 at the $50.00 per share high and potentially ending with a larger Double Bottom price pattern at the $17.00 per share level (2013 and early 2014).
Aggressive traders enjoy calling market bottoms while more conservative traders need a little more ‘proof’ or evidence of a potential reversal.
Notice what’s happening now – a breakout above the falling 50 week EMA which is something that has not happened throughout the entire downtrend.
I zoomed-in the perspective to highlight the breakout – it’s the image at the top right of the chart (above $19.50).
Here’s a closer look at the Daily Chart of KOL:
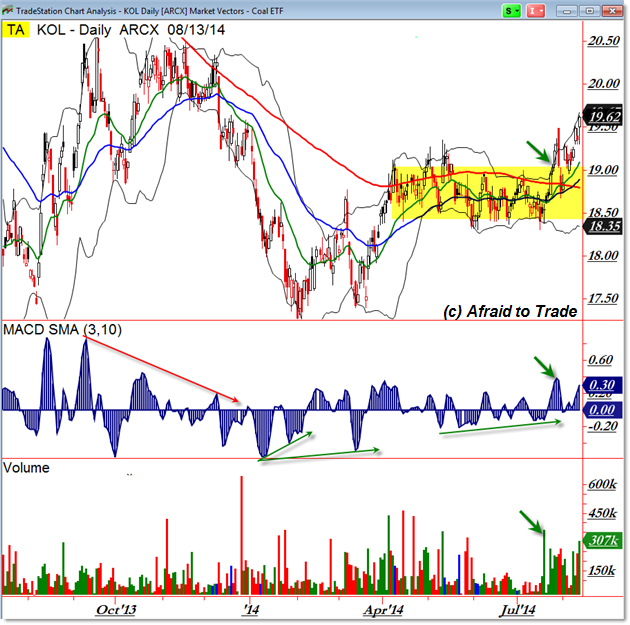
We do see the Double Bottom pattern with positive divergences at the start of 2014 which developed at least an initial bullish swing up toward $19.00 per share.
A sideways rectangle developed through the next few months and buyers pushed price higher above $19.00 in August, triggering the current breakout.
Note that Volume and Momentum also confirmed the breakout (they spiked higher along with price).
Should KOL continue the breakout, the next key target beyond $20.00 per share is the prior swing high near $20.50 per share.
Price could move quickly through the “Open Air” (no known resistance) and would be in the bullish green zone beyond $19.50.
Otherwise, a Bear Trap and reversal play would develop on a failure and return back under $19.00 per share.
Keep these levels in mind as we study the chart for additional bullish clues from price.
Please share this article
Let’s take a quick look at the Weekly and Daily Chart to highlight the key levels to watch, potential targets, and try to answer the question “Is this THE breakout?”
First, I’m showing a longer-term weekly chart of the coal ETF symbol KOL.
We can see a persistent and relentless DOWNTREND beginning in 2011 at the $50.00 per share high and potentially ending with a larger Double Bottom price pattern at the $17.00 per share level (2013 and early 2014).
Aggressive traders enjoy calling market bottoms while more conservative traders need a little more ‘proof’ or evidence of a potential reversal.
Notice what’s happening now – a breakout above the falling 50 week EMA which is something that has not happened throughout the entire downtrend.
I zoomed-in the perspective to highlight the breakout – it’s the image at the top right of the chart (above $19.50).
Here’s a closer look at the Daily Chart of KOL:
We do see the Double Bottom pattern with positive divergences at the start of 2014 which developed at least an initial bullish swing up toward $19.00 per share.
A sideways rectangle developed through the next few months and buyers pushed price higher above $19.00 in August, triggering the current breakout.
Note that Volume and Momentum also confirmed the breakout (they spiked higher along with price).
Should KOL continue the breakout, the next key target beyond $20.00 per share is the prior swing high near $20.50 per share.
Price could move quickly through the “Open Air” (no known resistance) and would be in the bullish green zone beyond $19.50.
Otherwise, a Bear Trap and reversal play would develop on a failure and return back under $19.00 per share.
Keep these levels in mind as we study the chart for additional bullish clues from price.
Please share this article
Steve Sjuggerud: The No. 1 “no-brainer” trade in the world today

The reasoning is simple.
A weaker euro is politically the easiest fix available…
You see, Europe is struggling right now. But inflation is not a problem. So a weaker currency is an easy fix. And that is the exact solution that Europe is pursuing today.
If you haven’t taken advantage of this situation yet, there’s an easy way to do it through your regular brokerage account. (more)
Please share this article
Subscribe to:
Posts (Atom)