Let’s take a quick look at the Weekly and Daily Chart to highlight the key levels to watch, potential targets, and try to answer the question “Is this THE breakout?”

First, I’m showing a longer-term weekly chart of the coal ETF symbol KOL.
We can see a persistent and relentless DOWNTREND beginning in 2011 at the $50.00 per share high and potentially ending with a larger Double Bottom price pattern at the $17.00 per share level (2013 and early 2014).
Aggressive traders enjoy calling market bottoms while more conservative traders need a little more ‘proof’ or evidence of a potential reversal.
Notice what’s happening now – a breakout above the falling 50 week EMA which is something that has not happened throughout the entire downtrend.
I zoomed-in the perspective to highlight the breakout – it’s the image at the top right of the chart (above $19.50).
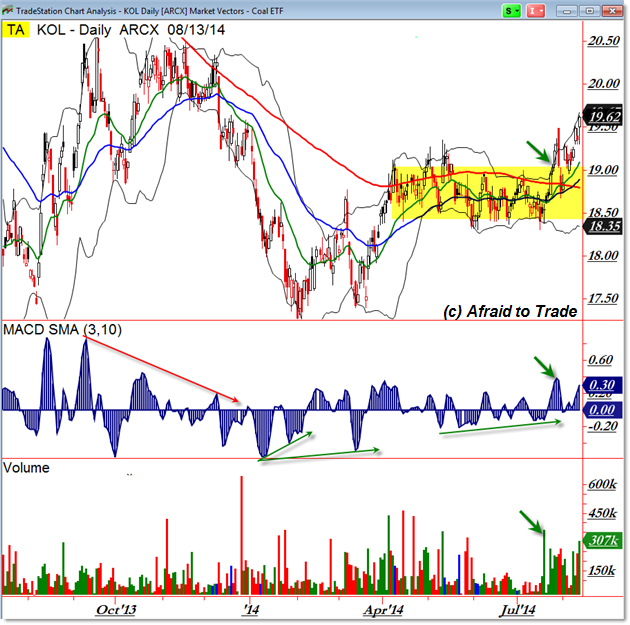
Here’s a closer look at the Daily Chart of KOL:

We do see the Double Bottom pattern with positive divergences at the start of 2014 which developed at least an initial bullish swing up toward $19.00 per share.
A sideways rectangle developed through the next few months and buyers pushed price higher above $19.00 in August, triggering the current breakout.
Note that Volume and Momentum also confirmed the breakout (they spiked higher along with price).
Should KOL continue the breakout, the next key target beyond $20.00 per share is the prior swing high near $20.50 per share.
Price could move quickly through the “Open Air” (no known resistance) and would be in the bullish green zone beyond $19.50.
Otherwise, a Bear Trap and reversal play would develop on a failure and return back under $19.00 per share.
Keep these levels in mind as we study the chart for additional bullish clues from price.
Please share this article
No comments:
Post a Comment