Saturday, March 24, 2012
Lindsey Williams : The Secrets of the Elite 2012
(Lindsey williams - proof Negative Show - 14 March 2012 ) is back with some more insights from his elite friends , some of the key points, are : in order to understand the elite's mind set you need to listen to the buzz words in this case the 'derivatives' which will bring the total collapse of the financial system and the death of the US Dollar by the end of 2012 , this does not mean that the dollar won't be existent, it means that it will lose most of its purchasing power (due to hyperinflation) there will be no shortages of food but the prices will be sky-high , prepare for $6 or $7 gas a gallon , Saudi Arabia is building the biggest oil refinery in world's history in china and soon it will be selling its oil to china without using the petro dollar aka the US dollar this will precipitate the death of the US Dollar

The HARPEX Index is superior to the Baltic Dry Index!
Like many analysts and economists I have been an avid follower of the Baltic Dry Index (BDI) as a so-called leading indicator of global economic activity. However, I have come to the conclusion that the BDI as such is of no further use to me. The massive growth in demand for commodities from especially China from 2005 to 2008 led to a significant increase in capacity as the number of ships built surged through until the 2010 crisis that resulted in a major change in supply from relatively inelastic to highly elastic. Furthermore, it means that changes in the Baltic Dry Index occur in what is essentially a downtrend or, put differently, in a bear market.
However, I have discovered an indicator that is far superior to the BDI. The HARPEX Index was developed by Harper Petersen, a global leading chartering agent. The Index is calculated by using the actual time charter rates for seven classes of ships. This index therefore measures the rates of moving mostly finished goods globally and is an excellent indicator of global consumer activity. Unfortunately the historical data on the website only date back to 2009. (http://www.harperpetersen.com/harpex/harpexVP.do)
In the graph below I depicted the HARPEX Index against my GDP-weighted Major Economies Manufacturing PMI as well as the Markit Eurozone PMI, with both the PMIs leading by two months. In the graph it is evident that the HARPEX Index should be rated highly as a coinciding indicator in any economic forecasting model. The value of manufacturing PMIs as leading indicator comes to the fore as it is evident that the GDP-weighted manufacturing PMI of the major economies leads the HARPEX Index by two months. The bottoming and subsequent rise of the PMIs in January this year indicated that the HARPEX Index would rise through end March. It has indeed risen from $376 at the end of February to $393 currently. The slight weakening of the major economies’ PMI in February indicates that freight rates in April are likely to go nowhere and even decline.

Sources: Harper Petersen; CFLP; Li & Fung; Markit; ISM; Plexus Asset Management.
The value of the HARPEX Index can be seen in the following graph. During the great financial crisis in 2008/2009 the HARPEX Index fell to $300 and remained relatively unchanged until February 2010. The global manufacturing sector started to expand in August 2009 when the GDP-weighted Major Economies Manufacturing PMI rose above the 50 level in August 2009. It therefore took six months of global expansion to take up the slack in the container shipping industry. Thereafter the PMI and the HARPEX Index moved in the same direction, with the PMI leading by approximately two months.

Sources: Harper Petersen; CFLP; Li & Fung; Markit; ISM; Plexus Asset Management.
The current level of the HARPEX Index is indicative of how weak the global manufacturing sector really is. This sector is still in a much better shape than in 2009 as the HARPEX Index is still 30% higher than the presumably $300 absolute minimum level at which ships can operate. In my opinion any further strength in the global manufacturing sector is likely to have an immediate impact on global containerized freight rates as the sector is not recovering from a deep recession as it did in 2009.
In a recent article I presented you with a graph of my calculated PMI seasonal factors of the CFLP Manufacturing for China against the Baltic Dry Index, which not only explained the weakness in the BDI but also the shorter-term movements in the BDI. I argued that January/February would also mean a seasonal low for the Baltic Dry Index and a major reversal would be evident in March and April.
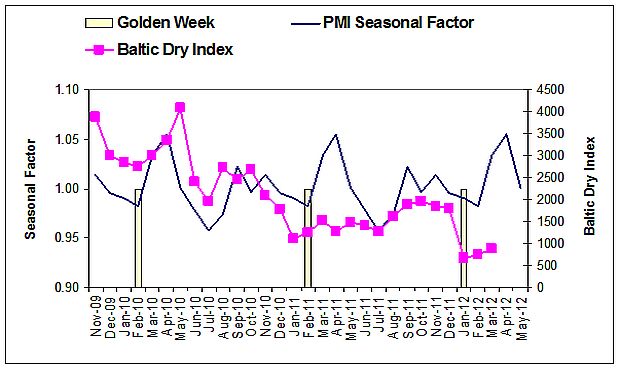
Sources: CFLP; Li & Fung; I-Net Bridge; Plexus Asset Management.
The BDI subsequently made a low of 647 on 3 February and is currently at 897. Although the BDI is up 38.6% it is still a far cry from what it should normally have been in light of the usually strong seasonal period. It is therefore an indication of the underlying weakness of China’s manufacturing sector.
Although I argue that changes in the Baltic Dry Index occur in a bear market due to the underlying fundamental factors, the BDI should not be discarded in total as it does give an indication of the underlying strength of China’s manufacturing sector. I regard the HARPEX Index as a better coincident indicator of global economic activity.
Fifteen questions to ask yourself before buying any stock
In Common Stocks and Uncommon Profits, legendary investor (and one of the rare people to influence Buffett’s investment style) Philip Fisher provides fifteen questions to ask yourself before investing in a company. These are aimed at identifying the qualitative factors that are associated with well managed companies with strong growth prospects. Here they are:
- Does the company have the products or services with sufficient market potential to make possible a sizable increase in sales for at least several years?
- Does the management have a determination to continue to develop products or processes that will further increase sales when the growth potential of current product lines has largely been exploited?
- How effective are the company’s R&D efforts in relation to its size?
- Does the company have an above average sales organization?
- Does the company have a worthwhile profit margin?
- What is the company doing to maintain or improve profit margins?
- Does the company have outstanding labor and personnel relations?
- Does the company have outstanding executive relations?
- Does the company have depth to its management?
- How good are the company’s cost analysis and accounting controls?
- Are there other aspects of the business, somewhat peculiar to the industry, which will give the investor important clues as to how outstanding the company may be in relation to its competition?
- Does the company have a short range or long range outlook in regards to profits?
- In the foreseeable future, will the growth of the company require sufficient equity financing so that the larger number of shares then outstanding will largely cancel the existing stockholders’ benefit from this anticipated growth?
- Does the management talk freely to investors about its affairs when things are going well but “clam up” when troubles and disappointments occur?
- Does the company have a management of unquestionable integrity?
You can get a copy of Fisher’s book here. What questions do you ask yourself before investing?
John Perkins : we are close to an Economic Collapse more than ever before
Interview with John Perkins author of "Confessions of an Economic Hit Man" ."Confessions of an Economic Hit Man" author John Perkins argues that the United states has created a modern-day empire through the use of economic blackmail and the undermining of foreign governments.John Perkins spent three decades as an Economic Hit Man, business executive, author, and lecturer. He lived and worked in Africa, Asia, the Middle East, Latin America, and North America. Then he made a decision: he would use these experiences to make the planet a better place for his daughter's generation. Today he teaches about the importance of rising to higher levels of consciousness, to waking up - in both spiritual and physical realms - and is a champion for environmental and social causes. He has lectured at universities on four continents, including Harvard, Wharton, and Princeton.
Ellis Martin Report with David Morgan March 23 2012
from OpportunityShow:
Ellis Martin interviews David Morgan in the second of a three part discussion. Mr. Morgan recently posted a video on Youtube entitled, “Silver is the Achilles Heel to the Entire Economic System” http://www.youtube.com/watch?v=QHc4Vp4I9_I Mr. Martin chose to ask about the reasoning for putting together such a piece as well as attempting to identify the audience for such a message as well as the purpose for it. Is trading in silver and gold usurping the system? Dr. Ron Paul weighs in before Congress and Chairman Bernanke on the subject in the referenced video.
Signs of recovery grow in housing market
The battered housing market looks to be on the mend as buyers make a tentative return and house prices stabilize.
Sales of new homes in February fell from January but jumped more than 11 percent compared with the same month last year and prices rose, according to data released on Friday that was in line with other recent signs of a slow recovery.
Big challenges lie ahead, most notably in the form of a glut of unsold properties - many of them foreclosures - and tight lending by banks. But even if the recovery is slow and bumpy, the worst of the six-year slump seems to be over.
"The housing market is slowly coming back. It's still a depressed market, but it's getting better. We have a long way to go," said Patrick Newport, an economist at Global Insight in Lexington, Massachusetts.
New home sales slipped 1.6 percent to a seasonally adjusted 313,000-unit annual rate in February, the lowest since October, but were up 11.4 percent in year-on-year terms, the Commerce Department said.
The median new home price jumped 8.3 percent to an eight-month high of $233,700. Compared with February last year, the rise was 6.2 percent.
The report rounded off a week of mixed U.S. housing data and followed a similar pattern seen in the bigger market for existing homes - sales also fell in February, but stayed close to their highest level in nearly two years and prices rose for the first time on a yearly basis since November 2010.
Realtors say they are seeing higher traffic volume and are moving more houses off the market than a few years ago.
"My listings are selling much more quickly compared to the past few years, even approaching 2007 pre-crash levels," said Lindsey Sanders, a Realtor with Muffley & Associates in Atlanta.
"I began seeing a meaningful uptick in open house traffic last summer and it has continued to improve. I think this is a combination of sellers finally becoming more willing to ask market prices for their homes instead of bubble-level prices."
Builders tell a similar story. An index measuring confidence among homebuilders held at a near four-year high this month and they anticipated an increase in sales over the next six months.
While the pace of home construction fell last month, permits for future projects approached a 3-1/2-year high. Much of the activity is concentrated in the multi-family segment, as demand for rentals soars.
SPOTTY RECOVERY
The recovery remains spotty. According to CoreLogic, for every two homes sold, there is one that could be foreclosed. It estimated the so-called shadow inventory of homes at 1.6 million in January, down from 1.8 million a year ago.
KB Home, the fifth-largest U.S. homebuilder, on Friday said net orders for new homes declined 8 percent in its first quarter as cancellations rose.
"Don't expect this to be a broad-based, rocket-ship recovery," said KB Homes Chief Executive Officer Jeff Mezger on an earnings call. "The overall housing market is better, but this is definitely a localized recovery ... and in some cases, it's a zip-code-by-zip-code recovery."
KB's order decline was in sharp contrast to the strong order growth reported by other U.S. homebuilders, including D.R. Horton, Pulte and Lennar, who have forecast an improving housing market.
While the pace of new home sales held above 300,000 units for a sixth straight month, they are just over a fifth of their 1.389 million unit peak reached in July 2005.
"Mindful that more healing needs to be done, we expect new home sales in 2012 to post their first annual increase in seven years, rising 12 percent," said Sam Bullard, a senior economist at Wells Fargo Securities in Charlotte, North Carolina.
Last month, the inventory of new homes on the market was unchanged at a record low 150,000 units. At February's sales pace it would take 5.8 months to clear the houses from the market, up from 5.7 months in January.
New home sales last month surged in the Northeast and West but slumped in the South and Midwest.
New home sales account for about 7 percent of the overall housing market and face stiff competition from the used home segment despite low levels of stock.
"Buyers have been able to take their time as they have little fear that prices or rates will get away from them. Mortgage rates, though, are beginning to rise slowly and that could continue through the rest of the year," said Joel Naroff, chief economist at Naroff Economic Advisors in Holland, Pennsylvania.
"Add price increases to that and there is a little more urgency to the decision. So while investors may be disappointed by this report, I think better times are just about here so be a little more patient."
Subscribe to:
Posts (Atom)