Friday, August 15, 2014

Eaton Vance Corp (NYSE: EV)

Eaton Vance Corp., through its subsidiaries, engages in the creation, marketing, and management of investment funds in the United States. It also provides investment management and counseling services to institutions and individuals. Further, the company operates as an adviser and distributor of investment companies and separate accounts. As of October 31, 2004, the company provided investment advisory or administration services to approximately 150 funds; approximately 1,300 separately managed individual and institutional accounts; and participated in approximately 40 retail-managed account broker/dealer programs. It markets and distributes shares of funds through a retail network of national and regional broker/dealers, banks, insurance companies, and financial planning firms.
Take a look at the 1-year chart of Eaton (NYSE: EV) with my added notations:
1-year chart of Eaton (NYSE: EV)
After its steep January drop, EV has been range bound since February. Over that period of time the stock has formed a clear resistance at $38.50 (red). In addition, the stock has also created a common level of support at $35 (green). At some point the stock will have to break one of the two levels the consolidation has created.

The Tale of the Tape: EV has clear levels of support ($35) and resistance ($38.50). The possible long positions on the stock would be either on a pullback to $35, or on a breakout above $38.50. The ideal short opportunity would be on a break below $35.
Please share this article

Thursday, August 14, 2014

Is the the Breakout You’ve Been Waiting for in Coal? KOL

I’m seeing increased chatter about Coal stocks and ETF KOL regarding a potential breakout and larger reversal.
Let’s take a quick look at the Weekly and Daily Chart to highlight the key levels to watch, potential targets, and try to answer the question “Is this THE breakout?”
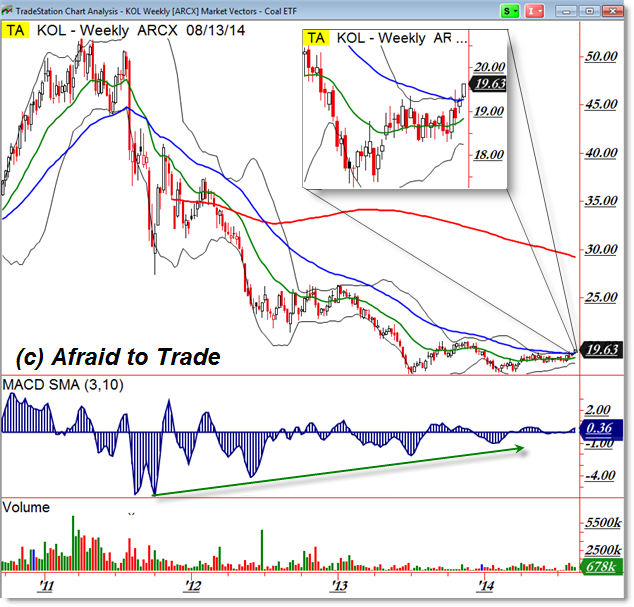
First, I’m showing a longer-term weekly chart of the coal ETF symbol KOL.
We can see a persistent and relentless DOWNTREND beginning in 2011 at the $50.00 per share high and potentially ending with a larger Double Bottom price pattern at the $17.00 per share level (2013 and early 2014).
Aggressive traders enjoy calling market bottoms while more conservative traders need a little more ‘proof’ or evidence of a potential reversal.
Notice what’s happening now – a breakout above the falling 50 week EMA which is something that has not happened throughout the entire downtrend.
I zoomed-in the perspective to highlight the breakout – it’s the image at the top right of the chart (above $19.50).
Here’s a closer look at the Daily Chart of KOL:
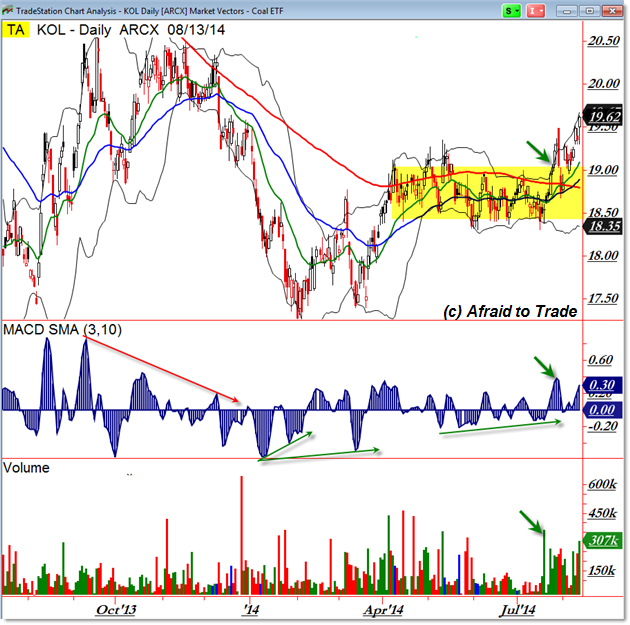
We do see the Double Bottom pattern with positive divergences at the start of 2014 which developed at least an initial bullish swing up toward $19.00 per share.
A sideways rectangle developed through the next few months and buyers pushed price higher above $19.00 in August, triggering the current breakout.
Note that Volume and Momentum also confirmed the breakout (they spiked higher along with price).
Should KOL continue the breakout, the next key target beyond $20.00 per share is the prior swing high near $20.50 per share.
Price could move quickly through the “Open Air” (no known resistance) and would be in the bullish green zone beyond $19.50.
Otherwise, a Bear Trap and reversal play would develop on a failure and return back under $19.00 per share.
Keep these levels in mind as we study the chart for additional bullish clues from price.
Please share this article

Steve Sjuggerud: The No. 1 “no-brainer” trade in the world today

Europe’s currency – the euro – is going down…
The reasoning is simple.
A weaker euro is politically the easiest fix available…
You see, Europe is struggling right now. But inflation is not a problem. So a weaker currency is an easy fix. And that is the exact solution that Europe is pursuing today.
If you haven’t taken advantage of this situation yet, there’s an easy way to do it through your regular brokerage account.  (more)

Please share this article

Honeywell International Inc. (NYSE: HON)

Honeywell International Inc. operates as a diversified technology and manufacturing company worldwide. Its Aerospace segment provides turbine propulsion engines, auxiliary power units, environmental control and electric power systems, engine controls, flight safety, communications, navigation, radar and surveillance systems, and aircraft lighting products for aircraft manufacturers, airlines, business and general aviation, military, space, and airport operations, as well as offers management and technical, logistics, aircraft wheels and brakes, and repair and overhaul services.
Take a look at the 1-year chart of Honeywell (NYSE: HON) with the added notations:
1-year chart of Honeywell (NYSE: HON)
HON has held a very important level of support at $90 (green) for most of the last 6 months. No matter what the market has done since February, HON always found support at that level when tested. Now, the stock has approached $90 again, and that might provide another bounce higher.

The Tale of the Tape: HON has a key level of support at $90. A trader could enter a long position at $90 with a stop placed under the level. If the stock were to break below the support, like a lot of stocks are doing lately, a short position would be recommended instead.
Please share this article

Krispy Kreme Doughnuts (NYSE: KKD)

Krispy Kreme Doughnuts, Inc., together with its subsidiaries, operates as a branded retailer and wholesaler of doughnuts, beverages, and treats and packaged sweets. The company operates through four segments: Company Stores, Domestic Franchise, International Franchise, and KK Supply Chain. It owns and franchises Krispy Kreme stores. As of May, 2014, the company had approximately 800 stores in approximately 20 countries in North America, Latin America, Asia/Pacific, the Middle East, and Europe.
Take a look at the 1-year chart of Krispy Kreme (NYSE: KKD) with the added notations:
1-year chart of Krispy Kreme (NYSE: KKD)
KKD has been declining since November of last year. Starting in February the stock had found a repeated area of support at $16 (blue). KKD finally broke that support back in the beginning of July, and then rested it as resistance several times thereafter. The stock should be moving overall lower from here.

The Tale of the Tape: KKD had a key level of support at $16. Now that the stock has broken support, a trader might want to enter a short trade at or near the $16 level with a stop placed above that level. A break back above $16 could negate the forecast for a move lower.
Please share this article

Chart of the Day - Kaiser Aluminum (KALU)

The Chart of the Day belongs to Kaiser Aluminum (KALU).  I found the stock by sorting today's New High list for new high frequency in the last month then used the Flipchart feature to review the charts. Since it signaled a buy on 6/5 the stock gained 12.23%.

KALU is a leading producer of fabricated aluminum products for aerospace and high strength, general engineering, automotive, and custom industrial applications. Repeatedly acknowledged as `Best in Class` among its global customer base, their 11 fabrication plants typically produce and ship more than 500 million pounds of product annually.
Please share this article

Wednesday, August 13, 2014

IS This A Trade In Corn?

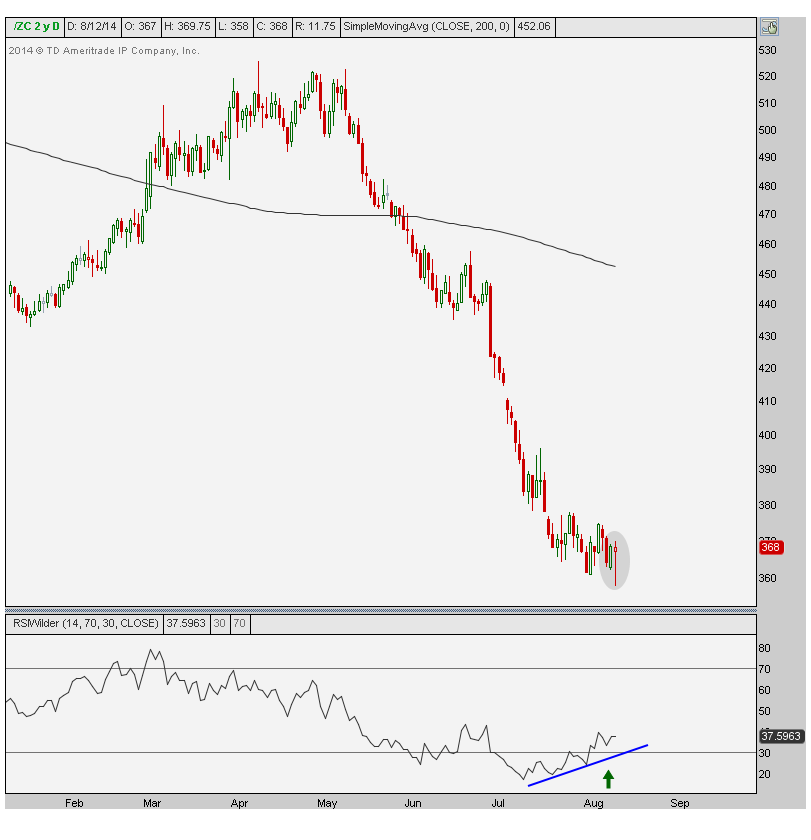
Coming into the USDA crop report I tried to make a game plan and come up with what would be the perfect scenario for an entry point in Corn. When a security of any kind gets killed for months going into an announcement like this, a lot of the bad news is likely priced in. The market is clearly expecting a bad number. I’m not going to sit here talking about corn inventories or even what the number was; that doesn’t even matter to us. It’s the market’s reaction that we care about. The point is, we were looking for the aggressive sellers to take the bad news and keep selling. In this scenario, the market would put in a new 4-year low while momentum diverges positively. An immediate reversal higher is our confirmation of a bottom.
Normally the market never does what you hope, but I’ve seen this scenario play out too many times to not hope and anticipate that it will develop. It might be one of my favorite setups in fact. Sure enough, the announcement came out, the knee-jerk was lower, Corn made new lows, and then immediately reversed higher:
8-12-14 zc
A candlestick like this coming off an announcement of this magnitude is the epitome of ‘sell the rumor buy the news’. The Japanese call this type of Candlestick a “Hammer”, because they say the market is “Hammering in a bottom”. Tuesday’s post announcement low is where I’d place my stop. The target is up near 420 which was support from January. We can go higher than that for sure, but that’s the first area we’re eying. With Corn at 366, this gives Corn bulls a very favorable risk/reward ratio, which is really all we care about.
Also look how far we are from the 200 day moving average. The mean reversion process just began I believe. Follow through higher on Wednesday would be very bullish in my opinion.
Please share this article