Wednesday, July 2, 2014

Raytheon Company (NYSE: RTN)

Raytheon Company develops integrated products, services, and solutions in the areas of sensing; effects; command, control, communications, and intelligence; mission support; and cyber and information security worldwide. It operates in four segments: Integrated Defense Systems; Intelligence, Information, and Services; Missile Systems; and Space and Airborne Systems. Raytheon Company serves the U.S. Department of Defense (DoD), the U.S. Intelligence Community, the Federal Aviation Administration, the U.S. Armed Forces, the National Oceanic and Atmospheric Administration, Department of Homeland Security, the National Aeronautics and Space Administration, and other international customers.
Please take a look at the 1-year chart of RTN (Raytheon Company) below with my added notations:
1-year chart of RTN (Raytheon Company)
For the most part, RTN rallied nicely up to April of this year. However, the stock has been trading sideways for the last few months while holding an important level of support at $95 (blue). Earlier this week the stock finally broke that support. RTN should be moving overall lower from here.

The Tale of the Tape: RTN had a key level of support at $95. Now that the stock has broken support, a trader might want to enter a short trade at or near the $95 level with a stop placed above that level. A break back above $95 could negate the forecast for a move lower.
Please share this article

Ask The Expert – John Williams (June 2014) | Sprott Money News


Please share this article

Tuesday, July 1, 2014

Breakout into Open Air for 3D Systems DDD

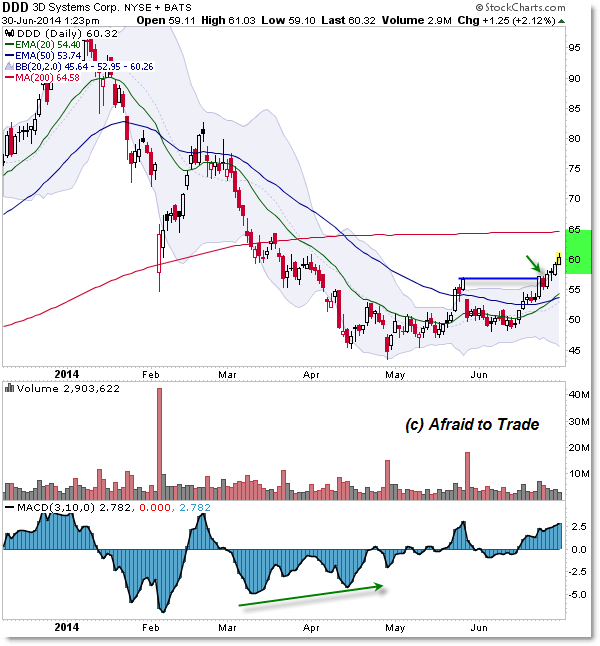
Last week I highlighted a “Tracking a Reversal and Breakout Opportunity for 3D Systems DDD” and this week, I wanted to provide an update as price moves through the Open Air pocket as expected toward the likely target.
We’ll start with a quick recap of the Daily Chart and end with the Hourly Chart breakout in motion:

For a detailed description of entry and targets, see the prior post from last week as I highlighted the breakout opportunity.
The chart above simply shows the breakthrough above the $57.00 resistance area and the recent four days of (almost) straight up price action toward the initial $60.00 target and also the extended $65.00 per share 200d SMA and price overlap target.
Let’s focus our attention now on the intraday (hourly) chart for smaller trade set-ups and potential price action higher towards the upper targets:

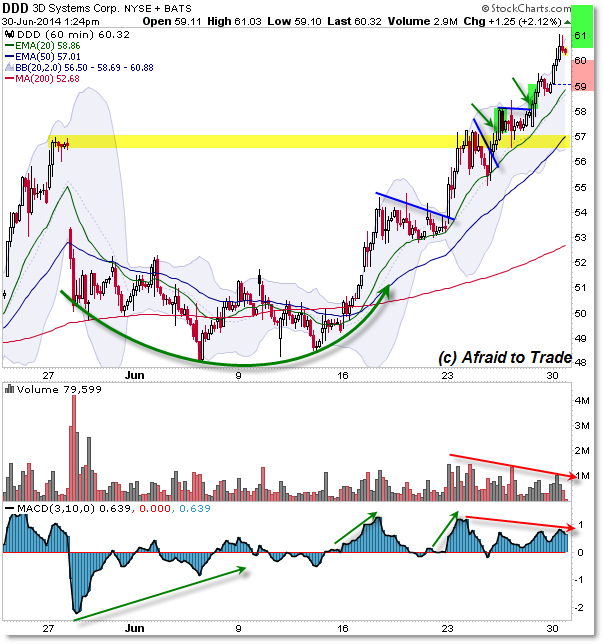
Let’s start with a “Rounded Reversal” and momentum divergence example that tracked through the month of June.
Note the push down away from $57 toward the $48 level as positive divergences developed with a “Rounded Reversal” price pattern.
From there, we saw a breakout above the $51.00 level and price has traded up in ‘reversal’ format since mid-June as would expected from the “divergence and rounded reversal” chart pattern.
Short-term or even intraday traders can buy ‘flag’ retracements as highlighted on the journey higher.
Otherwise, swing traders had a recent opportunity to join the bullish breakout above the $57.00 per share resistance as buyers broke price to new highs.
Short-sellers helped push share prices higher with their collective stop-loss orders, and they will continue to do so should the intraday uptrend continue above the $61.00 per share level.
We do note small volume and momentum divergences so keep that in mind as you trade through the “Open Air” pocket.
Be cautious on any surprise breakdown under the $60.00 per share level.
Otherwise, look to trade additional intraday ‘flags’ (retracement) – with stops trailed under prior lows – should price indeed continue its breakout toward the $65.00 target.
Please share this article

Insider Silver Code Triggered – Guerilla Economist V and W


Please share this article

‘Smart Money’ Hedgers Are Buying Up Grains

Coming into the new year, Commodities were a major theme for us on the long side, specifically the Agricultural futures. These guys did great for the first quarter and the strength continued throughout the first half the second quarter. But over the past 6 weeks or so, the Grains have gotten hit pretty hard. As prices have corrected the early 2014 gains, the “Smart Money”, or Commercial Hedgers, took notice and have started to buy Corn, Wheat and Soybeans.
Here is a chart comparing the Net Hedger Positions in Grains with the price of the DJ-UBS Grains Subindex ETN $JJG. I find it very interesting that when the Smart Money is Net Long these names, the price of $JJG tends to bottom out and rally. We are now just entering Net Long territory after this price correction:
Click Chart to Embiggen
6-30-14 jjg and comm hedgers net long
From Sentiment Trader:
“We also want to pay attention when they go net long a particular commodity. Because their underlying businesses are almost always naturally “long” the underlying market, they are usually selling short the futures. So when they go net long, it’s a notable event.
That’s what we have in grains now. The iShares Dow Jones-UBS Grain ETF (JJG) is the most established fund that tracks these markets. It is weighted approximately 41% to corn, 34% to soybeans and 25% to wheat. We used those weights to compute a hedger index for the futures, which is what is shown above.
It has just turned positive, meaning that hedgers are now net long. The green highlights show the other times they were net long, and we can see that each of them coincided with bottoming phases in JJG.
Unfortunately that ETF only goes back to 2007, but if we look at the underlying commodities, the hedger index was successful at most frequently highlighting bottoming phases in the grains. While we can always see some shorter-term gyrations, on a multi-month time frame we should see JJG rally.”
I don’t think that just because the Commercial Hedgers are net long, we should dive in head first without any risk management strategies. But I think it’s a space that is worth looking into a little closer. The $JJG owns Corn, Beans and Wheat. If $JJC gives us a nice risk/reward entry point, then we can execute a position. How and when to enter depends on your time frame and risk parameters. For us, right now today is not that time. But I think we’re really close.
Please share this article

Breakout in MannKind MNKD

Volatile stock MannKind (MNKD) crossed traders’ scans this morning with a breakout opportunity.
Let’s take a look at the breakout set-up and note the key levels to watch for protection and profit:

I highlighted three prior areas from the stocks’ journey higher in 2014 and you can compare the outcome.
February resulted in a small breakout that reversed into the $6.50 upper Bollinger target while March’s breakdown collapsed the stock to the $4.00 level.
After the gap and stable sideways action into May, price broke above the $7.00 per share level but this time volume flooded into the stock as the price traded higher in a strong bullish impulse that carried price straight-up from $7.00 to the current $11.00 stable rectangle level.
That’s where we pick-up today’s set-up where shares trigger another breakout trading opportunity.
For another recent breakout opportunity, view my post from last week on a similar set-up in 3-D printing stock 3D Systems (DDD).
So far, volume is strong on the breakout into “Open Air” (no resistance) above $11.00 per share but as always, traders taking the aggressive pro-trend breakout must protect themselves should price trade back under the resistance barrier at the $11.00 per share level.
For price (trade) planning, any “surprise” reversal back into the rectangle ($10.00 to $11.00) should lead to a sudden retest of the $10.00 per share support target.
Instead, any clean breakdown under the $10.00 multi-support level opens a “short sale” bull trap downside pathway for a reversal and deeper retracement lower.
Otherwise, we do note the possibility for another impulsive bullish surge higher should buyers once again step in aggressively and bid price through the “Open Air” and new price highs not seen since 2010 (let’s use the May 2014 period as a reference).
Let’s step back to see the impressive rally in this bullishly dominated stock:
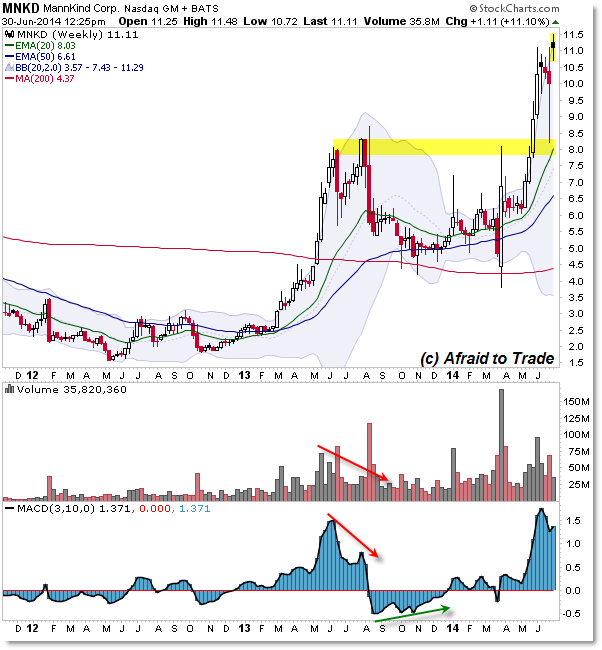
The weekly chart provides a wider perspective from 2012 to present and the Rounded Reversal that developed all through 2012 to set the stage for the stellar bullish action of 2013.
A reversal down in late 2013 took this stock off traders’ radars, though the renewed life in 2014 with the breakout above the highlighted $8.00/$8.50 level.
For now, keep your perspective on the Daily Chart price levels and the potential for another possible bullish surge to the upside.
Please share this article

Monday, June 30, 2014

American Capital Ltd. (NASDAQ: ACAS)

American Capital, Ltd. is a private equity and venture capital firm specializing in management and employee buyouts, subordinated debt, leveraged finance, mezzanine, acquisition, recapitalization, middle market, early venture, mature, industry consolidation, and growth capital investments. The firm seeks to invest in senior debt mezzanine, unitranche, and equity financing for buyouts of private equity firms and direct in private and public companies. It also invests in special situations and in government. In special situations, the firm invests in troubled situations and in distressed situations. The firm also considers smaller investments as add-on acquisitions for existing portfolio companies.
To review American’s stock, please take a look at the 1-year chart of ACAS (American Capital, Ltd.) below with my added notations:
1-year chart of ACAS (American Capital, Ltd.)
Over the last 5 or 6 months ACAS has traded mostly sideways, while forming a trend line of support (blue). Always remember that any (2) points can start a trend line, but it’s the 3rd test and beyond that confirm its relevance. As you can see, the market deems ACAS’ trendline to be very important. In addition, the stock also has a key level of resistance at $16 (red).

The Tale of the Tape: ACAS has a trend line support and a $16 resistance. A long position could be entered on a break above $16, or on a pullback to the trendline, with a stop placed below the level of entry. A short position could be entered if ACAS were to break below trendline or if the rally continues up to $16.
Please share this article