Let’s take a look at the breakout set-up and note the key levels to watch for protection and profit:

I highlighted three prior areas from the stocks’ journey higher in 2014 and you can compare the outcome.
February resulted in a small breakout that reversed into the $6.50 upper Bollinger target while March’s breakdown collapsed the stock to the $4.00 level.
After the gap and stable sideways action into May, price broke above the $7.00 per share level but this time volume flooded into the stock as the price traded higher in a strong bullish impulse that carried price straight-up from $7.00 to the current $11.00 stable rectangle level.
That’s where we pick-up today’s set-up where shares trigger another breakout trading opportunity.
For another recent breakout opportunity, view my post from last week on a similar set-up in 3-D printing stock 3D Systems (DDD).
So far, volume is strong on the breakout into “Open Air” (no resistance) above $11.00 per share but as always, traders taking the aggressive pro-trend breakout must protect themselves should price trade back under the resistance barrier at the $11.00 per share level.
For price (trade) planning, any “surprise” reversal back into the rectangle ($10.00 to $11.00) should lead to a sudden retest of the $10.00 per share support target.
Instead, any clean breakdown under the $10.00 multi-support level opens a “short sale” bull trap downside pathway for a reversal and deeper retracement lower.
Otherwise, we do note the possibility for another impulsive bullish surge higher should buyers once again step in aggressively and bid price through the “Open Air” and new price highs not seen since 2010 (let’s use the May 2014 period as a reference).
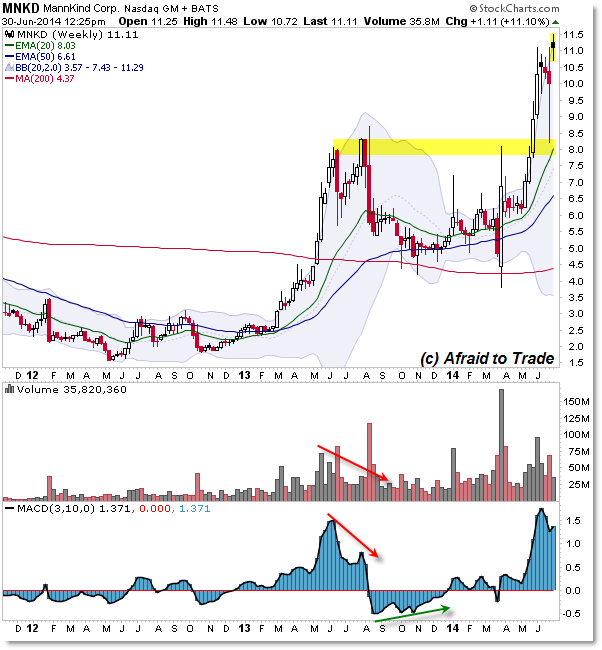
Let’s step back to see the impressive rally in this bullishly dominated stock:

The weekly chart provides a wider perspective from 2012 to present and the Rounded Reversal that developed all through 2012 to set the stage for the stellar bullish action of 2013.
A reversal down in late 2013 took this stock off traders’ radars, though the renewed life in 2014 with the breakout above the highlighted $8.00/$8.50 level.
For now, keep your perspective on the Daily Chart price levels and the potential for another possible bullish surge to the upside.
Please share this article
No comments:
Post a Comment