First, here is a weekly line chart showing these lows just below 19 tested successfully 3 times. Where I come from triple bottoms and triple tops are very very rare, if they even exist at all. In all likelihood, as I mentioned on Fox Business in late May, we’ll see a 4th or 5th test that eventually cracks the support. Well as we can see in this chart, we’re seeing just that: a 4th test of support in a commodity that is still in a 3+ year downtrend:
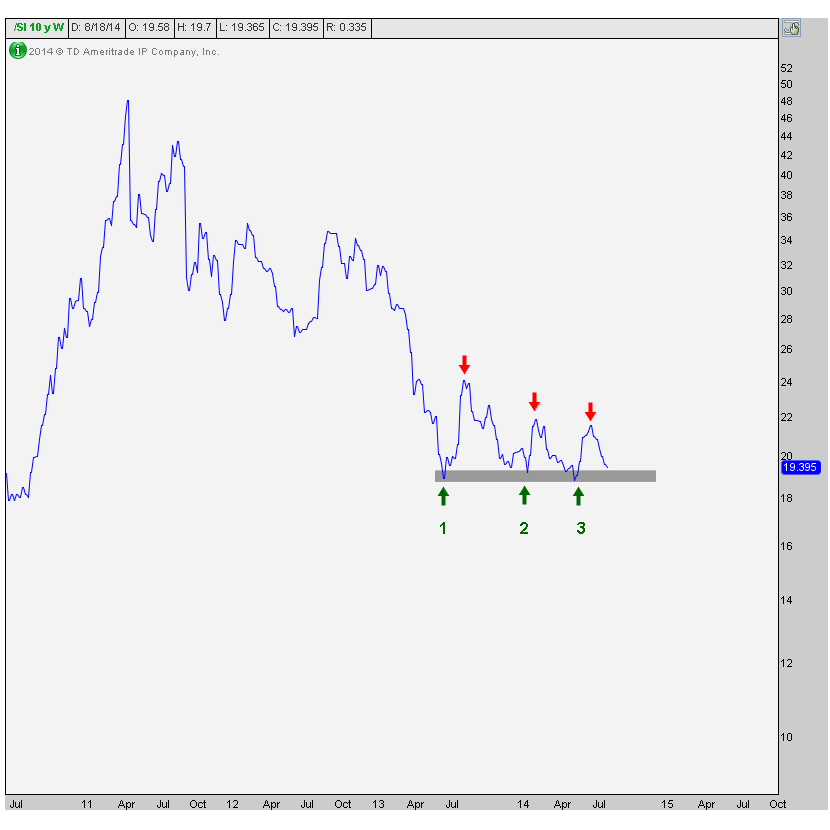
We have yet to see any evidence that this downtrend is reversing. In fact, with each bounce off this key support level, the sellers have become less and less patient. Notice how each rally off support has been weaker and weaker. The theory is that the next bounce won’t be much of a bounce at all and support will break leading to a bigger sell off. (more)
Please share this article
No comments:
Post a Comment