Let’s start with the Daily Chart and plot future levels for this potential bullish reversal.

Keeping it simple, shares have the potential to break bullishly above the $7.00 price level toward the confluence of the falling 200 day SMA ($8.44) and price high from March 2014.
The breakout signal did not trigger today, and thus we’re only setting up a game-plan to plan potential trades.
Shares remain in the neutral/bullish zone between $6.50 and $7.00 and otherwise would trigger a bearish breakdown (downtrend continuity) reversal under $6.00.
Plan entry, management, and targets based on these levels.
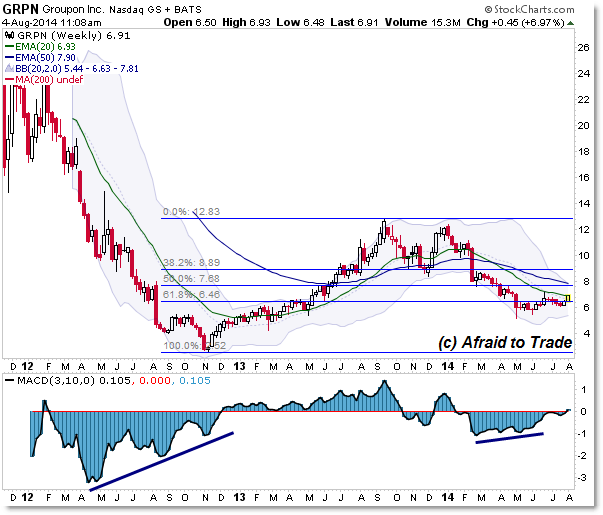
We get a bit more perspective from the Weekly Chart:

I drew a short-term Fibonacci Retracement of the 2012 to 2013 rally and highlight price trading slightly under the 61.8% level near $6.50.
On this grid, Fibonacci levels include (roughly) $6.50, $7.70, and $8.90.
We again see a confluence with the $9.00 per share target mentioned above.
Again, should shares fall into the resistance cluster near $7.00 (falling 20 week EMA) then the downtrend would likely continue without a reversal signal.
Update your charts and trade-plans with these target reference level.
Please share this article
No comments:
Post a Comment