We’re looking at a 1 year daily candlestick chart for $ZN_F to represent the benchmark 10yr note. Look at the series of higher lows since last summer with clear overhead supply just above the 125 level. I really love it when we have a flat top like this:
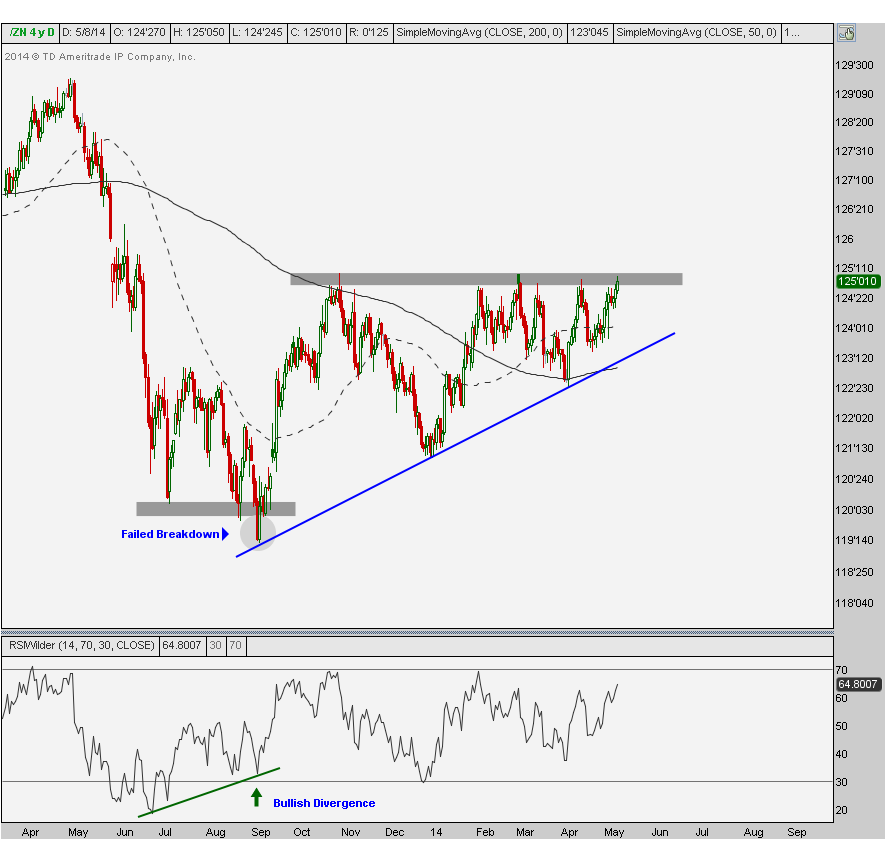
The more times that a level is tested, the higher the likelihood that it breaks. We’re now going on 6 attempts to break through this resistance. When you have prices above their 50 and 200 day simple moving averages, with a beautiful uptrend line like this, it almost seems inevitable that a breakout is coming.
This isn’t the best news for interest rates. Looks like they are heading a lot lower if/when we do get this breakout in bonds.
Please share this article
No comments:
Post a Comment