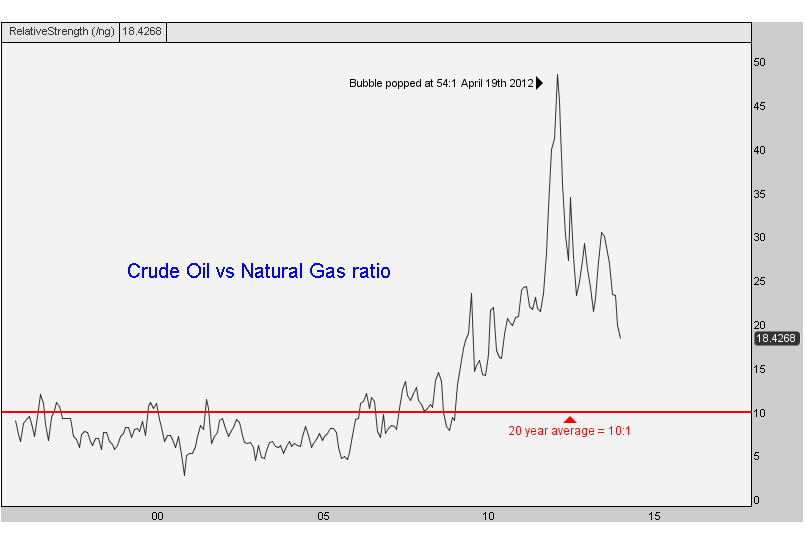
I wrote countless blog posts about this, mentioned it on TV several times, and followed up afterwards. But the crash continues into 2014. What was once as high as 54:1 is now down to 18:1 and still falling hard putting in fresh multi-year lows this month. Here’s the beauty of the whole thing: prices are still 45% away from the historic mean. And more importantly remember that, “we are not just in a reversion to the mean business, but in a reversion beyond the mean business” (to quote Soros’ technician John Roque).
Here is the chart of the bubble popping and subsequent crash:
Please share this article
No comments:
Post a Comment