 Morris Hubbartt
Weekly Market Update Excerpt
posted Jan 20, 2012
Analysis
- Sentiment analysis is the art of gauging the herd mentality. When an investment becomes overcrowded, it’s an area to avoid.
- The dollar continues to be over-bought and over-loved by a herd of investors who seek a safe haven from the financial crisis. From a technical standpoint, the currency itself is due for a major sell-off this year, and that is likely to launch gold and silver dramatically higher.
- The numbers from the COT report continue to be astonishing. The smart money commercials are holding fewer dollars than at any time in the last 14 years, while the speculative herd continues to buy it at a near record pace.
- Over time the commercials usually win these battles. Keep in mind that just because the commercials are placing large bets against the dollar does not mean the dollar must start falling right away. In currency markets you need to have strong convictions and patience.
- There have been three rallies on the dollar and each rally has been accompanied by weaker action in the RSI indicator. In baseball it is “three strikes and you are out”. For the dollar, it is the 3rd time up to the “rally” bat, and the technical indicators suggest that the outcome for the dollar will be similar to baseball.
- I am projecting that the deteriorating technical condition of the dollar will cause a steadily rising gold price into the third quarter of this year, and that will be followed by an even stronger fourth quarter, but a lot depends on how strongly and how soon the dollar begins to decline. A $2300 gold price is highly likely in 2012.
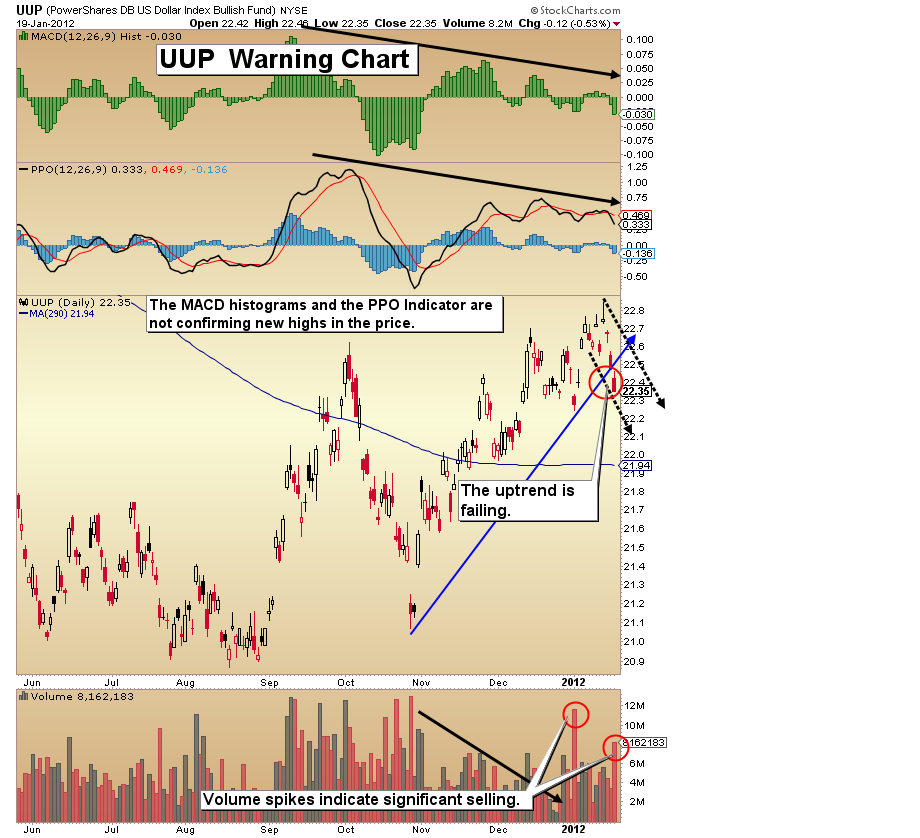
UUP (US Dollar Proxy) Warning Chart
- I have included a second chart this week. Here I examine the dollar via the UUP ETF. Technical indicators are warning that the time is near for the end of the current rally in the dollar.
- Note the divergences that have occurred at each of the three tops I have highlighted, and note the overall weakening of the RSI over the life of this chart.
- Time is running out to secure physical metal for yourself before the next leg down in the dollar commences. Note the black horizontal line on the chart near 83.56. I expect the primary bear trend to resume by that point or even earlier than that.
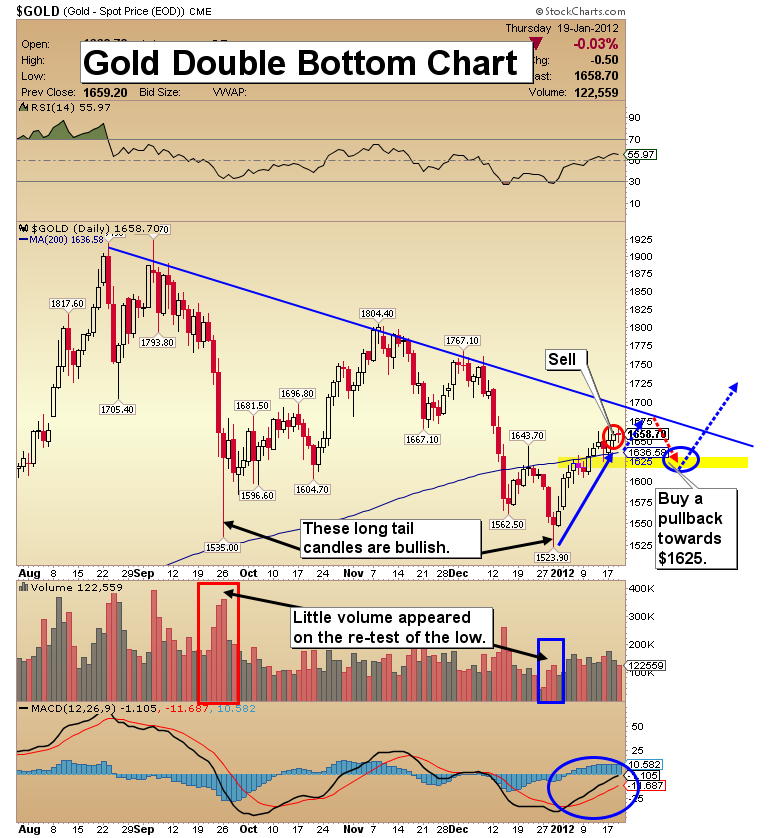
- The bearish US dollar set-up above has helped create a number of bullish set-ups for gold. Huge positions of dollars are being held by speculators while the commercials continue to flow their money into gold and silver.
- I recommended traders take a little off the table in the $1650 area. Re-buy near $1625. I am operating with a larger focus on long-term positions than short-term swing trades, because the weight of the technical evidence suggests a large move higher is coming.
- The $1680 price point likely corresponds roughly with the downtrend line I have highlighted on this chart, and I expect a reaction to around $1625 from there.
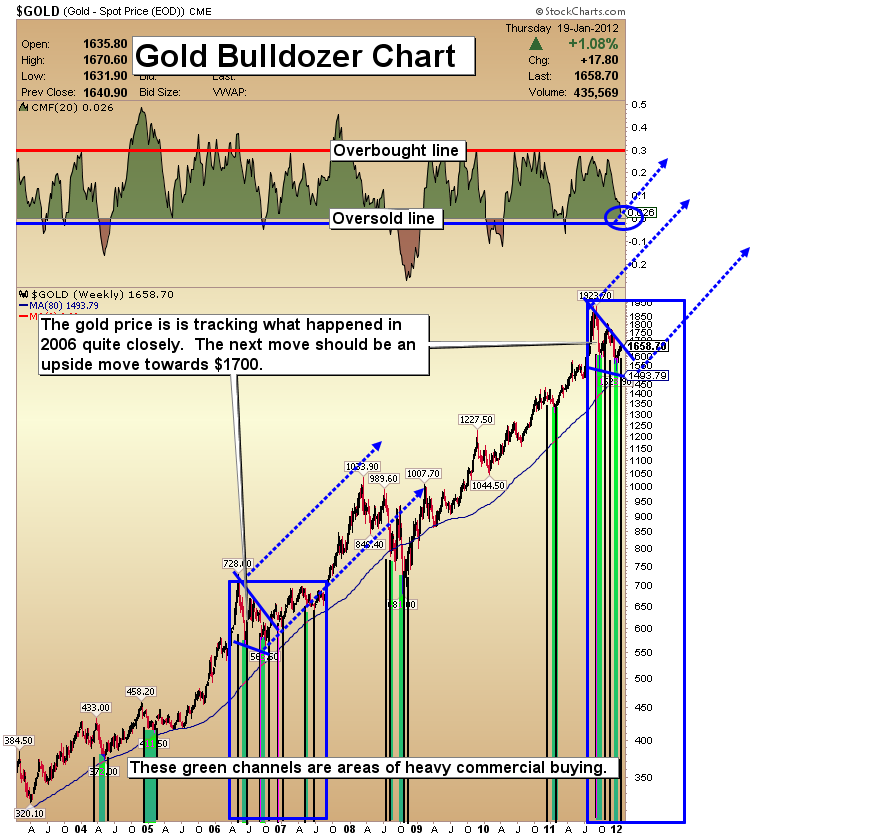
- The current down wedge on gold is very similar to the one I have highlighted on the chart in 2006. Note that when the price broke upside in 2006 there was more of a sideways chop with a strong upwards bias than a “surge” higher.
- I think this is how we experience the beginnings of what I’ve termed the gold superhighway; the gold price acts more like a bulldozer as it enters the highway. Notice that by the summer of 2007, gold began a violent and powerful move higher. The same type of action seems very likely now as gold moves out of the wedge formation; first some “bulldozing”, then the autobahn!
- Trying to outsmart this bull is really a fool’s game. Please don’t let fear-mongering by anyone convince you to sell your positions.
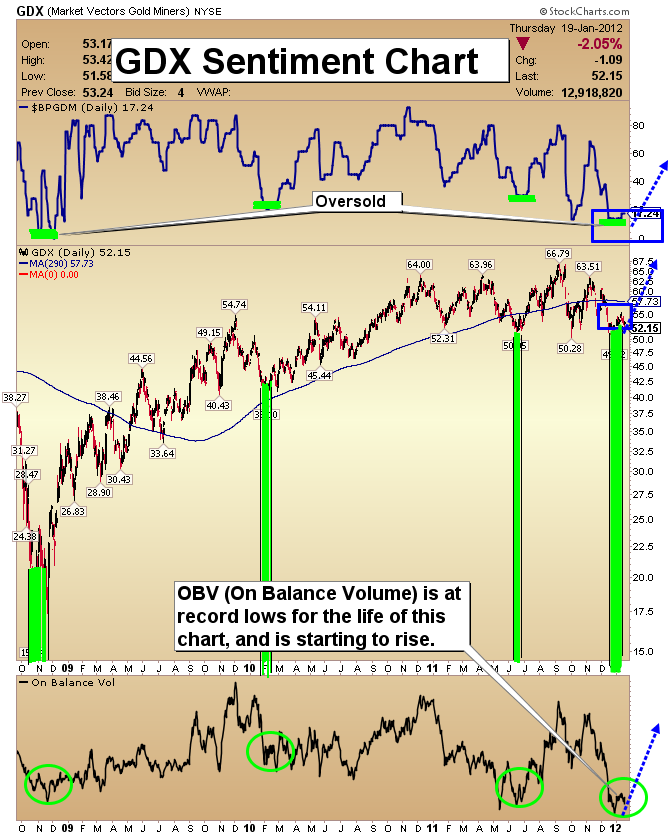
- I think this chart is one of the most important ones for gold stock investors. Note the strong contrarian buy signals highlighted in green. These buy signals have provided gains, ranging from 32% to well over 100% over periods of just several months.
- On Balance Volume (OBV) is at a record low for the life of this chart, and has started to creep higher.
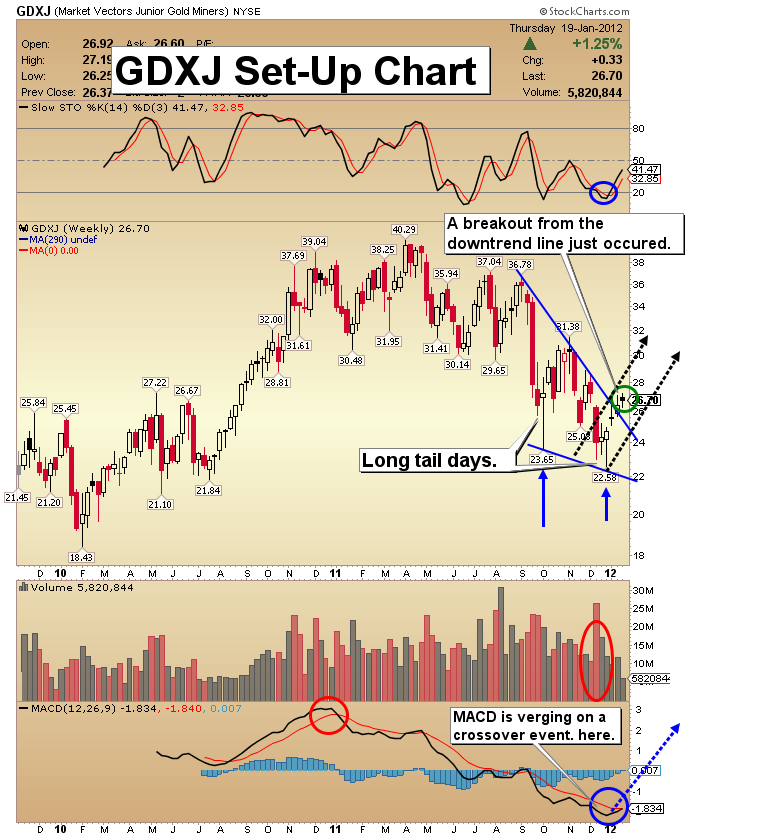
- GDXJ remains one of my favorite assets to hold for the next several months. By many metrics, these stocks are as cheap as they’ve been since the beginning of the bull market. Buy only on severe weakness, as this has proven to be a very volatile sector.
- The technical situation of GDXJ improved again this week, with the price rising above the blue downtrend line I’ve highlighted on the chart. That’s arguably a breakout from a falling wedge technical pattern.
- Note the action of the MACD indicator. The lines seem ready to cross into a classic buy signal, and that should bring some speculators back into this sector. GDXJ has also been outperforming GDX, which is another positive sign.
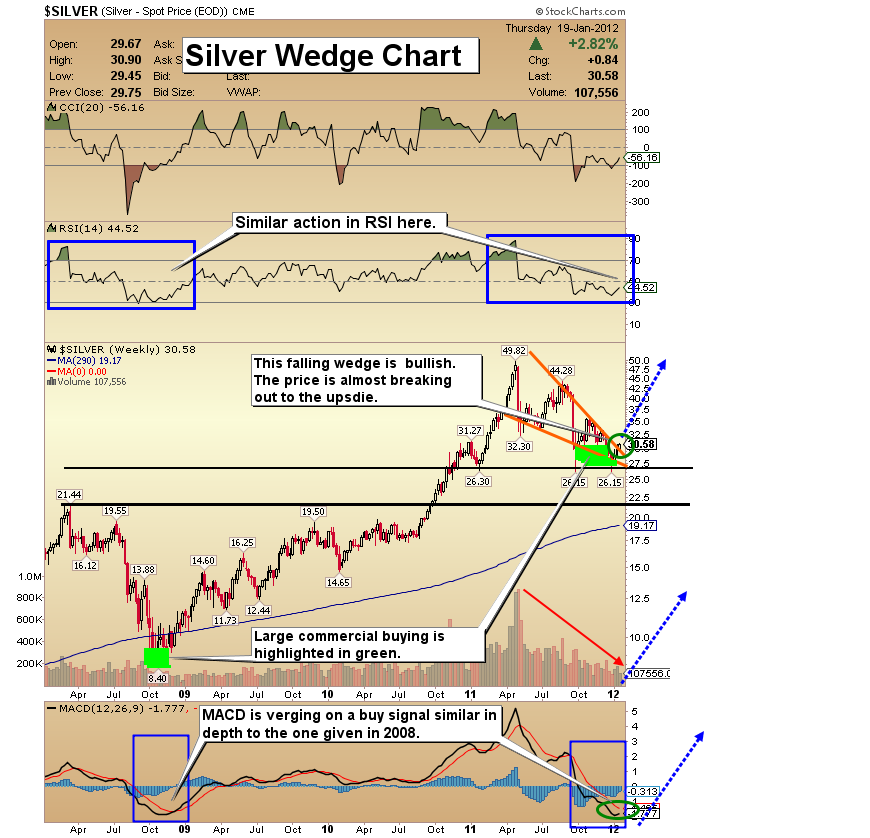
- The fundamentals for silver are solid. Physical silver inventories are being tapped and it is questionable as to how fast they are being replaced. My dealer reports a very tight physical market.
- Some analysts claim that the ratio of silver being consumed vs. mined is greater than 10 to 1. I don’t know about the validity of that statement, but certainly the enormous growth in the Asian middle class and the Asian economies is a reason to hold some silver.
- The CCI indicator has started to rise, MACD is hooking up, and the volume pattern is very bullish, with volume dropping in sync with the price all through this correction.
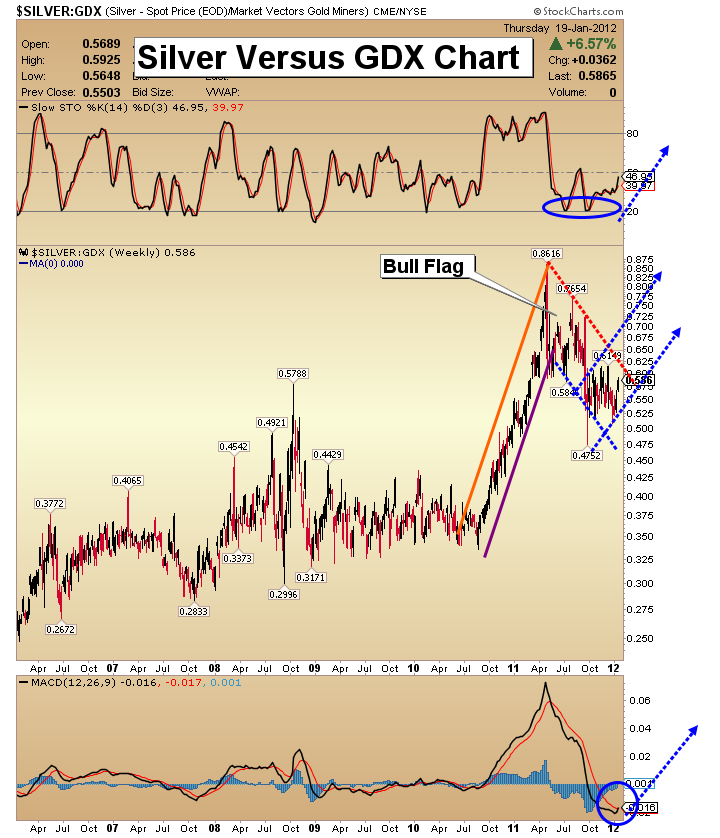
- I’m very bullish on gold and gold stocks but the above chart demonstrates why my current asset of choice is silver. Look at the bull flag pattern on this ratio chart of silver versus GDX.
- This flag pattern projects that silver in the $60 price range is likely within 12 months. Note the strong rising action of the MACD histograms that has occurred.
- When a crossover buy signal occurs, the action of the histograms can indicate the relative power of that signal, and in this case the histogram action suggests a bull move could be very powerful!
No comments:
Post a Comment