Natural prices has been in declines since the start of this year from $6.00/mmBTU to $3.883/mmBTU last Friday mainly to capacity build up. Here is the natural gas price chart since 2005:
click to enlarge
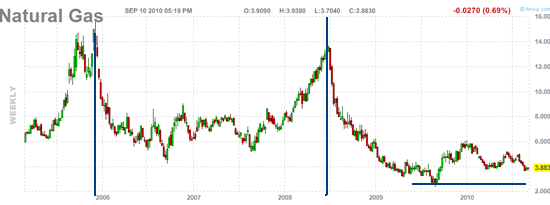
Let us look at the chart in more details:
Long Term Trend: During the five year span, NG prices went up to $14.00+/mmBTU twice: during the end of 2005 and in the middle of 2008, a two and half year span. If history repeats, we may see another major NG price run up next year. Another $14.00? It is a possibility.
Short Term Trend: The NG price had a major run up from September to December last year. After it set an all time low of $2.50 in September 1, 2009, it went up to as high as $6.00 in December, an 140% increase. This year' low (so far) was also set in September 1 at $3.70. It closed at $3.883 last Friday. We may see the near term momentum change during the next few months. History repeat again?
If we assume that the natural gas price bottomed at this price levels, what may be the stocks which may benefit from natural gas bull runs?
Our possible picks are SD, GMXR, CHK, HK, APTG, and SGY. (more)
No comments:
Post a Comment