Tuesday, September 15, 2015

Stocks to Watch: ZIOP, AXPW, VGGL, JBLU, CHK


ZIOPHARM Oncology Inc. (NASDAQ:ZIOP) continued to show strength with another gain. Today's rally put shares above the psychological resistance of 11, which is a bullish sign. The technical chart looks very bullish with a short-term target of $11.60.

 
Extremely bullish moves on Axion Power International, Inc. (NASDAQ:AXPW) are taking place over the last session’s. The stock was one of the big winners on Monday, closing up 62 cents on the day. It has been under accumulation for a couple days now. The volume on accumulation days consistently exceeded the volume on distribution days. That's a bullish sign. From a technical standpoint, the MACD chart is still showing an up trend with the MACD indicator above its signal line and is indicating further strength. The RSI value is currently above 60 but it has not reached the overbought territory. Let's keep an eye on AXPW as i think momentum will pick up. Next targets for the stock are $3.85 and $3.92


Viggle Inc (NASDAQ:VGGL) is displaying a short upside momentum and is poised to move higher from these levels. Despite the general market weakness, the stock made an impressive turnaround and rallied almost 3% to close the day at $1.50 on volume above average. Short term traders can buy above $1.54 with stoploss at $1.4 and targets of 1.79/2.02. Technical indicators show a continuation of the trend with MACD and RSI rising.


JetBlue Airways Corporation (NASDAQ:JBLU) has broken out to all time highs again. The volume on today’s break was solid, not great, so a sell-stop below $25.50 is probably a good idea.

Chesapeake Energy Corporation (NYSE:CHK) Setting up a possible resistance breakout trade. Long over 8.02


Small Speculators Gamble On Stock Market Decline By Taking All-Time Record Short Position In Stocks

kingworldnews.com / SEPTEMBER 14, 2015
With stocks a bit weaker and crude oil trading lower, today King World News is featuring a stunning piece that reveals small speculators are now gambling on a stock market decline by taking an all-time record short position in stocks.  This piece also includes two key illustrations that all KWN readers around the world must see.
Jason Goepfert of SentimenTrader warned:  “Small speculators in index futures went to $6 billion short this week.  New all-time extreme (see charts below).
READ MORE

Gold Short-Term Bottom? Trader Dan Norcini

Maybe…based on today’s price action in both the metal and in the mining shares ( HUI), but only short-term.
The shares were actually a bit more convincing than the actual metal, which is something one would like to see anyway if they are looking to be bullish.
The HUI opened lower, promptly fell apart but then began gradually climbing back up off the worst levels of the session as the day wore on. By the time of the close, they had managed to eke out a small gain.  (more)

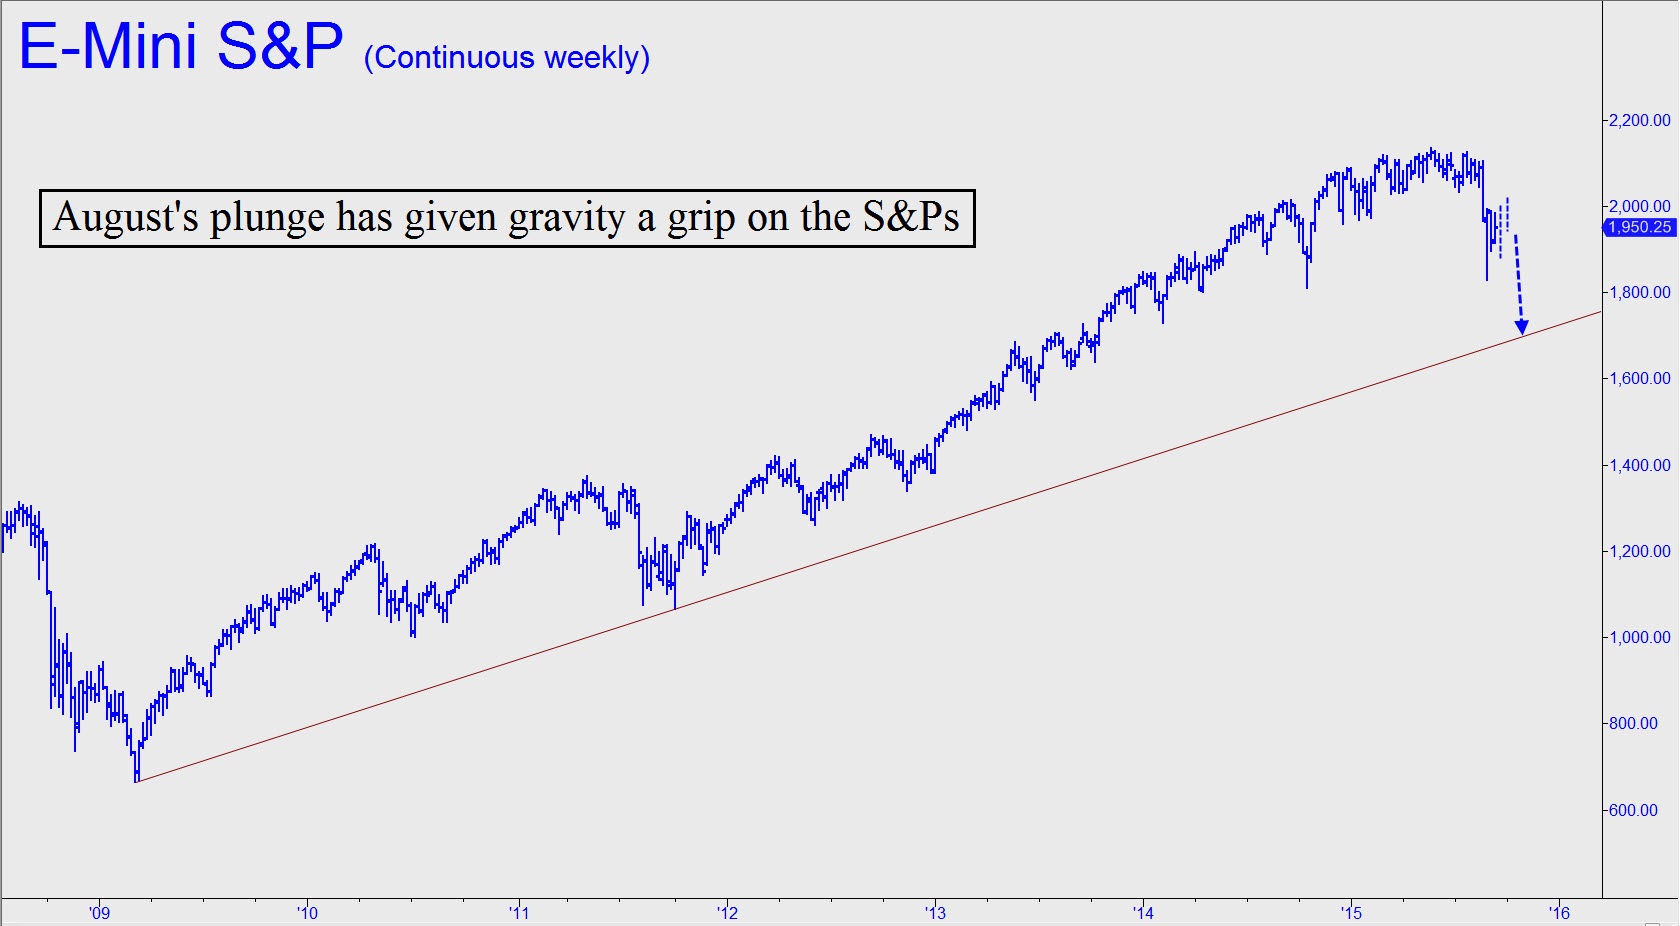
A Second Big Leg Down Is Coming In Stocks

Take a good look at the long-term chart shown and let it liberate your imagination. It’s not difficult to see the force of gravity at work here, pulling the S&Ps toward a trendline that lies 250 points below. Notice how, when the futures swooned last autumn, the recovery was much steeper and swifter than the decline. Not this time. Three weeks into a bounce that has been punctuated by manic, fleeting short squeezes, stocks have yet to recoup even half of the losses suffered during the last two weeks of August.

It would seem that the “story” needed to drive a strong rally simply isn’t there. The Fed can’t loosen because rates are already near zero. China’s economy is weakening rather than strengthening, and Europe is now a full-blown basket case. Adding to this disquieting picture, America’s enemies have grown increasingly bold and seem now to be daring Obama, the weakest and most inept U.S. president in history, to do something about it.  Not exactly a comforting picture. Under the circumstances, it seems safe to predict that the S&Ps will fall at least to the trendline shown, currently around 1700. If so, the Dow, now trading for 16433, would fall to 14000 — down 24% from May’s all time high of 18351.
And then what?  Elliott Wavesters might say the chart leaves room for a Wave Five surge to new record highs. That would be hard to imagine, considering that the coming recession, or perhaps depression, will leave the U.S. and global economies in a state of smoldering ruin. Whatever happens, we should keep an open mind. First, though, we’ll look for the broad averages to complete the bearish cycle begun in August with a drop to the trendline. The implication is that any rally in the days or possibly weeks ahead is a gift to those looking to get short.

Monday, September 14, 2015

Economic Collapse & The 7 Year Shemitah Cycle

Little-Known Indicator Calling for a Turning Point in the Market

There is an old trading adage I've always liked: "The market will scare investors out or wear investors out."
Prior to Aug. 20, we were in a wear-you-out stage. The Dow was trading in the narrowest range in more than 100 years of just 7.7% from top to bottom.

To make things worse, the S&P 500 had crossed its 50-day moving average a total of 35 times, exceeding the number of crosses ever seen in a full calendar year in the first eight months alone. And the vacillating, whipsaw nature of the sideways trend aggravated investors.
Just prior to the violent sell-off, I wrote about how the massive pickup in new lows indicated a stealth correction occurring in stocks. At the time, about 60% of S&P 500 stocks were down at least 10% for the year -- i.e., in official correction territory -- yet the index was basically flat.
Then, on Aug. 20, the market entered a scare-you-out stage. Traders embarked on a selling spree sparked by global growth fears that brought the index into full-blown correction territory in just four days.
The chart below shows the gargantuan spike in stocks making new 52-week lows as traders panicked and threw in the towel.
Wilshire 5000
The next graph shows how oversold the S&P 500 is using the Relative Strength Index (RSI) indicator. The number of S&P 500 stocks below 30 -- the standard oversold level -- went off the charts compared to every other sell-off in the past three years.  (more)

C R Bard Inc (NYSE: BCR)

C. R. Bard, Inc. designs, manufactures, packages, distributes, and sells medical, surgical, diagnostic, and patient care devices worldwide. The company offers vascular products, such as percutaneous transluminal angioplasty catheters, chronic total occlusion catheters, guidewires, fabrics, meshes, introducers, and accessories; valvuloplasty balloons; peripheral vascular stents, self-expanding and balloon-expandable covered stents, and vascular grafts; vena cava filters; biopsy devices; and temporary pacing electrode catheters for the treatment of peripheral vascular disease and heart arrhythmias.
Take a look at the 1-year chart of C.R. (NYSE: BCR) below with my added notations:
1-year chart of C.R. (NYSE: BCR)
BCR has created a simple chart pattern known as a symmetrical triangle. Combining a down trending resistance (red) with an up trending support (green) forms the triangle pattern. As the support and resistance converge on each other the pattern is created. Since there is no true way to know which way the stock will break, most traders will wait for the breakout or breakdown before entering a trade.

The Tale of the Tape: BCR has formed a simple symmetrical triangle. A trader could enter a long position on a break above the down trending resistance (near $195) with a stop set under the entry level. However, if BCR were to break below the trend line support (currently near $190), a short trade could be entered with a stop above the trend line.