Thursday, October 10, 2013

Ply Gem Holdings (NYSE: PGEM) :Could Rocket 50% From Current Levels

By many measures, 2013 is shaping up to be the best year for initial public offerings (IPOs) since 2007. The volume of new offerings has surged, and hot new issues such as FireEye (NASDAQ: FEYE), Rally Software Development (NYSE: RALY) and Epizyme (NASDAQ: EPZM) have already bagged triple-digit gains. A hotly anticipated IPO from Twitter is merely icing on the cake.
Yet amid the good news, some IPOs have been duds. Companies with short track records or an open-ended path to operating losses have been tossed in the IPO dust bin. But in the rubble, you will find some deep value plays. And building products firm Ply Gem Holdings (NYSE: PGEM) is one of them.
The recent IPO has traded down, but now appears to hold considerable upside.
PGEM Chart
When it comes to recent IPOs, it's often wise to steer clear until 180 days have passed. That's when insiders are free to sell shares as the "lock-up expiration" periods ends. Yet, in the case of PGEM, insiders are unlikely to head for the exits. (more)

Please share this article

A Double-Digit Rally in U.S. Treasurys Starts Now

Bond prices have soared for more than three decades.
 
As bond prices soar, yields fall: The yield on 10-year U.S. Treasurys peaked at 15.8% in 1981. Last year, it bottomed below 1.5%.
 
Now, some of the smartest minds in finance are calling for the death of the three-decade bull market in bonds. Yields have nearly doubled since just last summer.
 
Over the long term, these folks are probably right. Bond prices could fall for years (maybe even decades).
 
But right now, the smart bet is on higher bond prices. In fact, we have an opportunity to make money going against the pack and buying bonds...
 
As I explained, today's conventional wisdom is that U.S. Treasury bonds are a losing proposition. And that's the bet most investors continue to make...(more)
 
Please share this article

McAlvany Weekly Commentary

Your Antidote to BIG DATA/BIG BROTHER is Gold

About this week’s show:
-4th U.S. default is threatened
-Half the globe turns negative on U.S. Treasuries
-800k non-essential workers? No wonder we’re broke
Read | Subscribe@iTunes
Please share this article

Clean Harbors Inc (NYSE: CLH)

Clean Harbors, Inc., through its subsidiaries, provides environmental, energy, and industrial services in the United States, Puerto Rico, Canada, and internationally. It operates in four segments. The Technical Services segment offers hazardous material management services, including the packaging, collection, transportation, treatment, and disposal of hazardous and non-hazardous waste at company-owned incineration, landfill, wastewater, and other treatment facilities. The Field Services segment provides various environmental cleanup services on customer sites or other locations on a scheduled or emergency response basis, including tank cleaning, decontamination, remediation, and spill cleanup; used oil and oil products recycling. The Industrial Services segment offers industrial and specialty services, such as high-pressure and chemical cleaning, catalyst handling, decoking, material processing, and industrial lodging services to refineries, chemical plants, oil sands facilities, pulp and paper mills, and other industrial facilities. The Oil and Gas Field Services segment provides fluid handling, fluid hauling, production servicing, surface rentals, seismic services, and directional boring services to the energy sector serving oil and gas exploration, production, and power generation.
To review Clean's stock, please take a look at the 1-year chart of CLH (Clean Harbors, Inc.) below with my added notations:
1-year chart of CLH (Clean Harbors, Inc.) For almost the entire last year, CLH has been stuck within a common pattern known as a rectangle. Rectangle patterns form when a stock bounces between a horizontal support and resistance. A minimum of (2) successful tests of the support and (2) successful tests of the resistance will give you the pattern. CLH's rectangle pattern has formed a $60 resistance (red) and a $50 support (green). The stock has just hit resistance again and appears to be headed back down to support.

The Tale of the Tape: CLH has formed a rectangle pattern. The possible long positions on the stock would be either on a pullback to $50, or on a breakout above $60. The ideal short opportunity would be on a break below $50.
Please share this article

DryShips (NASDAQ: DRYS): A Rare Opportunity to Earn 134% a Year From This $3 Stock

With Wall Street currently fixated on the budget debate in Washington, it's easy to forget that there are actually other forces at work, with many sectors trading independently of the U.S. government drama.

Shipping stocks in particular are on the move and appear to have legs for further appreciation. The action is directly related to positive economic data out of China, which has led to expectations for continued investment in infrastructure projects.

Last month, China announced exports and manufacturing data that exceeded analyst expectations. Demand for autos also came in higher than projections, while inflation measures were relatively tame. This sets a perfect environment for Chinese policymakers to continue to invest in stimulus projects without fear of unwanted inflation.

As an aside, it doesn't really matter whether these reports are legitimate or not -- not in the short run at least. The fact that China's economic data points to modest growth and low inflation leads investors to believe that Chinese policymakers will continue to plow stimulus into the economy, driving demand for materials used in infrastructure projects. (more)

Please share this article

Wednesday, October 9, 2013

12 Very Ominous Warnings About What A U.S. Debt Default Would Mean For The Global Economy


Ominous Clouds - Photo posted on Instagram by annekejongA U.S. debt default that lasts for more than a couple of days could potentially cause a financial crash unlike anything that the world has ever seen before.  If the U.S. government purposely wanted to damage the global financial system, the best way that they could do that would be to default on U.S. debt obligations.  A U.S. debt default would cause stocks to crash, would cause bonds to crash, would cause interest rates to soar wildly out of control, would cause a massive credit crunch, and would cause a derivatives panic that would be absolutely unprecedented.  And that would just be for starters.  But don't just take my word for it.  These are the things that top financial experts all over the planet are saying will happen if there is an extended U.S. debt default.

Because they are so close together, the "government shutdown" and the "debt ceiling deadline" are being confused by many Americans.

As I wrote about the other day, the "partial government shutdown" that we are experiencing right now is pretty much a non-event.  Yeah, some national parks are shut down and some federal workers will have their checks delayed, but it is not the end of the world.  In fact, only about 17 percent of the federal government is actually shut down at the moment.  This "shutdown" could continue for many more weeks and it would not affect the global economy too much.

On the other hand, if the debt ceiling deadline (approximately October 17th) passes without an agreement that would be extremely dangerous. (more)
Please share this article

Euro’s New High Negates H&S Pattern

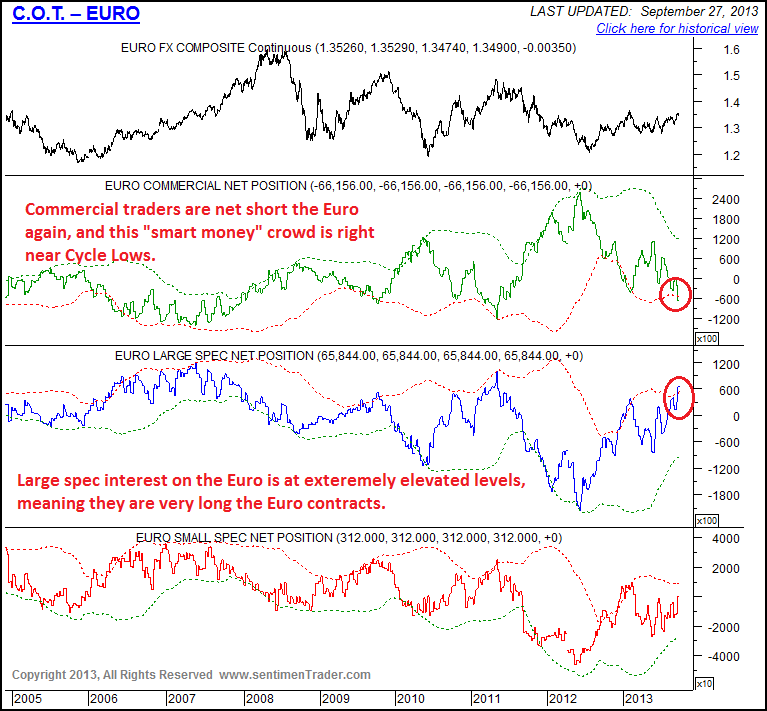
If Dollar sentiment is a warning that the Investor Cycle is coming to an end, then the same conclusion can be drawn from the Euro COT report.  It shows that Large Speculative bets on a rising Euro are at 2+ year highs, an extreme level that often marks a key Cycle pivot. The Commercial Traders (smart money) are net short the Euro for only the 2nd time in this 3 Year Dollar Cycle, so this is not a positive development for the Euro. Remember, though, that the COT reports are not in themselves a timing tool – but they do provide complimentary indicators to support the overall Cycles framework.
10-5_Euro_COT
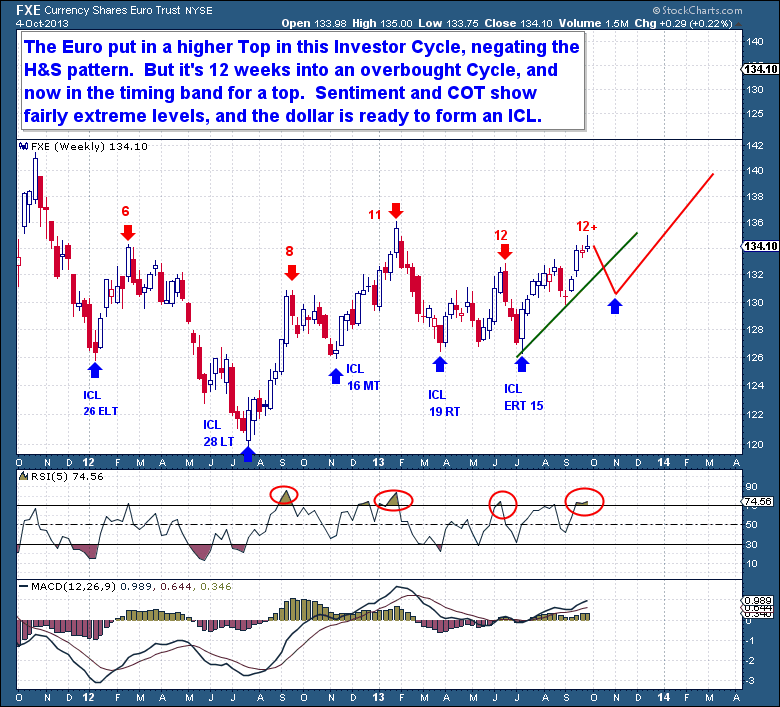
The Euro put in a higher Top in this Investor Cycle, negating a major weekly H&S pattern. The move higher confirms that the primary trend for the Euro is up, and that we should expect to see a continuation of this trend after the Euro completes its ICL. The Euro is only just breaking out of a 7 month consolidation, so I expect a sentiment clearing retracement into an ICL to recharge the Euro for another run higher.   
At 12 weeks into an overbought Investor Cycle, the Euro has moved into the timing band for an Investor Cycle Top.  Both sentiment and the COT report show levels that are indicative of a top, so investors should be prepared for the Euro to consolidate gains by moving toward its ICL.
10-5 Euro Weekly
The discussion of the Euro is critical to understanding the US Dollar. The Dollar’s weekly chart shows the momentum is now clearly to the downside.  Although the current Dollar IC is near completion, it topped in just 4 weeks and failed, strong evidence that 3 Year Dollar Cycle that has also topped.  But with the Euro ready to move downward into its ICL, there is reason to believe that a further move down by the Dollar may not be immediate.
Please share this article