Wednesday, February 29, 2012

5 Silver Stocks To Watch : EXK, PAAS, SLV, SLW, SVM

During periods of crisis, investors often flee risky asset classes and invest in assets or commodities that they feel will hold value. Silver is a prime example.

Silver is relatively rare and it is respected across borders; therefore, unlike currencies, it is believed to hold its value over time. While silver is not as popular as gold as a store of value, it has signifcant usages in various industries. It is this industrial demand that have convinced some that silver may be stronger investment than gold in the long term. The question is, what's the best way to invest in it?

Investing in Silver
While collecting jewelry with a high silver content or silver coins is the method preferred by some, there are downsides to consider. For example, there is the issue of finding a safe place to store such merchandise. Finding a buyer for a particular piece may also be difficult. Plus, there is sometimes a very big markup on certain pieces.

But there is an alternative for investors who want to gain exposure to silver: the stock market. Check out these five simple silver stock plays.

Company/ETF

Market Capitalization

Year to Date %

Silver Wheaton Corp (NYSE:SLW)

14.1B

33.29%

Silvercorp Metals Inc. (NYSE:SVM)

1.3B

16.09%

Endeavour Silver Corp. (NYSE:EXK)

0.97B

10.4%

iShares Silver Trust(ARCA:SLV)

11B

27.6%

Pan American Silver Corp. (Nasdaq:PAAS)

2.7B

16.41%


The Risks
The price of silver can fluctuate widely. In 2008, the price of silver had risen to about $21.44 an ounce, a huge increase given that just a couple of years prior it was trading around $11. But not too long after that spike, silver lost its luster, and the price floundered to $8.40. However, today, silver has popped up to above $30.

Bottom Line
Investors tend to flock to precious metals (like silver) in times of market crisis. Widespread international acceptance and recognition of this circumstance makes it likely that this trend will continue in the future.

CHART OF THE DAY: The Housing Triple Dip

A little more perspective on that bummer of a Case-Shiller report.

Housing has now done what could arguably be called a triple dip.

Since housing really began to tank, there have been two notable bumps, which each time seemed, perhaps, to represent the start of an uptrend in housing.

But ... still no dip. We've now had three dips, including the big one.

chart of the day, s&p case shiller home price indices, feb 28 2012

Martin Armstrong: The 13 Year Curse


Martin Armstrong: The 13 Year Curse


click here to read in pdf

Time to Add the VIX to Your Equity Portfolio?

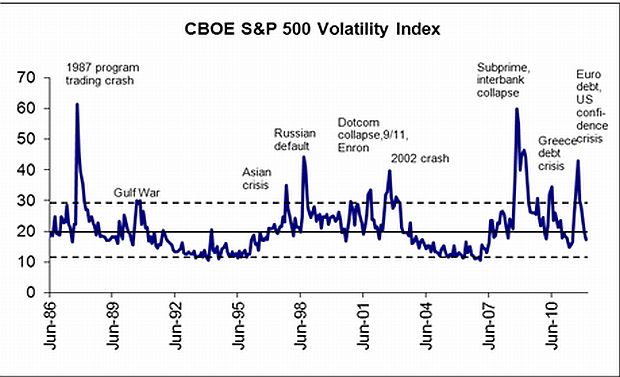
The interim solving of the debt crisis in Greece has restored calm in the markets, with the CBOE S&P 500 Volatility Index (VIX) settling at 17.3 compared to its long-term average of 20.0. The big question now is whether the VIX will return to the low levels of 1991-1996 and 2004-2006.

Sources: CBOE; Plexus Holdings.

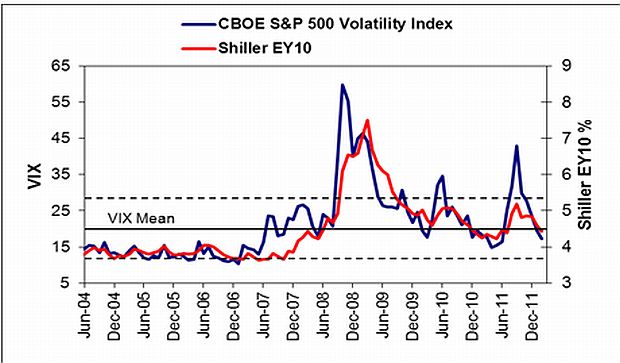
But why is it important? The two periods mentioned coincided with sustained strong rising equity markets. Let us take a look at the period 2004 to end 2006. The VIX fell to an average of approximately 13 over that period, while valuation levels as measured by Robert Shiller’s PE10 increased significantly. Please note that in the graph below I used the inverse of the PE10, which is in fact the earnings yield or EY10. The period was marked by strong steady global economic growth on the back of China’s fortunes, strong corporate profit growth and a significant increase in risk appetite.

Sources: Robert Shiller; CBOE; Plexus Holdings.

At this stage the market’s rating reflects the VIX, but where to now? While similar strong economic growth etc. may await us further down the road the same cannot be said for the next two years, let alone this year, as the weak global economic environment (a much weaker Chinese economy, the Eurozone’s continued woes and the relatively weak U.S. economy) is likely to persist. I am therefore of the opinion that a VIX of around 20 and a PE10 of 22 can be seen as fair value. These compare with the current VIX of 17.3 and PE10 of 22.6. Yes, optimism may drive the VIX down to 15 again and the PE10 to 25 but to me that will indicate a significant selling opportunity. Similarly, the more regular occurrence of black swans has led to a significantly changed investment environment. Yes, it has led to the VIX being more volatile than in the past.

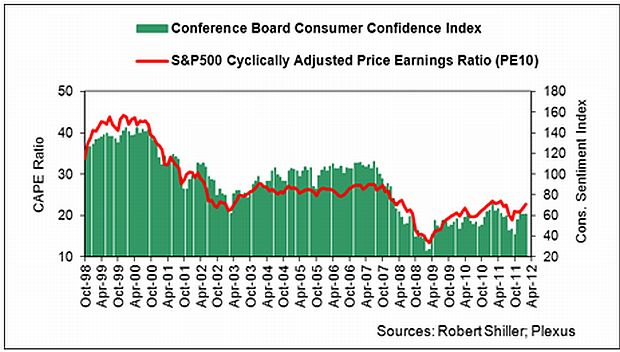
So much for volatility, but what about the underlying economic fundamentals? I have often referred to the relationship between consumer confidence and market valuation. Consumer spending is the backbone of the U.S. economy and is therefore the reason why consumer confidence gauges are closely watched by the major market players. At this stage it is evident that the S&P 500 Index (SPX 1367.59 ↑0.00%) at a PE10 of 22.6 is fully reflecting the Conference Board Consumer Confidence Index and therefore the underlying economy as it stands.

Some may argue that the employment situation in the U.S. remains dire and is likely to lead to another fall-off in consumer confidence. Well, my research indicates that consumer confidence in fact leads the U.S. unemployment rate by approximately nine months. With the Conference Board Consumer Confidence Index at 61.1 in January, it points to an unemployment rate of approximately 8% in the third quarter of this year compared to 8.3% in January this year.

Sources: I-Net; FRED; Plexus Holdings.

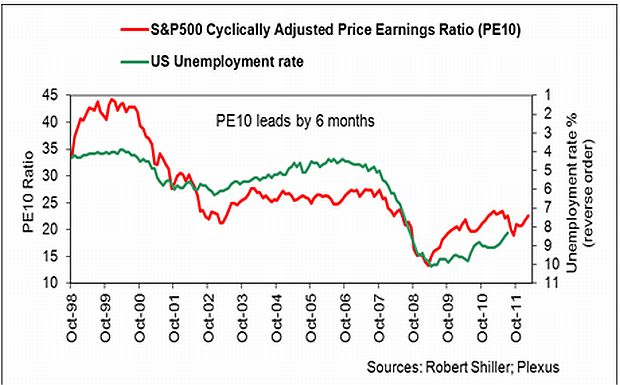
The valuation levels of the S&P 500, or PE10, lead the unemployment rate by approximately six months and are currently pointing to an unemployment rate of below 8% in the third quarter of this year.

I still hold the view that consumer confidence will improve to approximately 80 through end 2012 and that the valuation of the S&P 500 Index will improve to a PE10 of 25, meaning further upside of approximately 10% from the current levels. The going will be tough, though, as I think volatilities will remain high, resulting in the VIX ranging between 15 and 30 and the PE10 between 20 and 25.

Time to add the VIX to your equity portfolio? I think so.

Jay Taylor: Turning Hard Times Into Good Times


2/28/2012: A Royal Reversal of the American Revolution

Dan Norcini: Silver Shorts Literally Panic, Gold Shorts Now Worried

from King World News:

With silver breaking above the $37 level and gold trading $20 higher, today King World News interviewed legendary Jim Sinclair’s chartist Dan Norcini. Norcini told KWN what we are seeing today is a major breakout in the silver market and panic from the shorts: “Today we are seeing a strong move higher in silver and in gold, but particularly the silver market, which is up over 4%. Once silver took out $35.50 in a strong push, they ran a huge number of stops to the upside. There were a lot of shorts covering, Eric, there was literally a panic among the silver shorts.”

Dan Norcini continues: Read More @ KingWorldNews.com

This Is What Happens To The Stock Market After Rallying 15% In 3 Months


For all the bears crying foul over the current market rally, Bespoke Investment Group has some interesting research: market rallies of 15 percent or more are more often than not followed by greater gains.

Bespoke tallied three-month returns back to the late 1920s and found after a market rally in excess of 15 percent, the following three months were positive 77 percent of the time, averaging a 3.2 percent increase.

The S&P 500 has only run up 15 percent in a three month period 36 times, including the current rapid ascent.

Left, a look at the S&P rallies.