Tuesday, March 8, 2011

Is the Next Big Market Crash Just Around the Corner?

Two years ago this week, America was tightly held in the grip of the worst financial crisis in recent memory. On March 9, 2009 the S&P 500 stood at 676.53, while the Dow Jones Industrial Average had dropped to 6547. The CBOE Volatility Index, usually referred to as the "fear index," had reached 49, indicating that investor panic was at its heights.

ipad stocks touch

Many individual investors rode the markets down in sheer terror and made for a quick exit at the bottom, thus missing the biggest comeback in the equities markets since the days of the Eisenhower administration. Last week, the S&P 500 Index closed at 1321, nearly doubling its levels from two years ago. The Dow is up 86% over the last two years, recently closing at 12,169.

In addition, U.S. companies have been reporting record profits and are sitting on mountains of cash... $1.4 trillion as of last September.

Now, over the last several weeks, individual investors have come pouring back into stocks and mutual funds. But this time, it is different. Investors lack conviction about this historic market rally. Many are highly skeptical as surging oil prices, global unrest, and inflation fears mount. Adding to their concerns, the Federal Reserve's plan to officially end their second round of quantitative easing at the end of June.

Our forecast: The Federal Reserve will move into QE3 before the end of 2011. Political resistance to a new round of quantitative easing could be overcome by allowing a market correction to spook investors. Expect theatrics from the Fed in the name of "asset price stabilization" as the year unfolds. Individual investors will remain skiddish into the summer. Any announcement of QE3 will propel the markets higher and improve confidence. Any correction in between the two programs could present a buying opportunity.

China's #1 Short-Term Goal: Avoid Mideast Style Turmoil

This weekend, China announced new plans to increase incomes for the nations' poor and to reign in growing inflation. The ambitious economic plans are set to begin this year and will extend through 2015. Over the last five years, wages in China have failed to keep up with gains in productivity and economic growth. In addition, China has announced a goal of eradicating poverty by 2020.

These new and sudden lofty goals all make sense given the turmoil currently rocking the Middle East. The Chinese know that unrest begins at the bottom, and are therefore seeking to appease the poorest of its citizens with economic hope. And while new plans for the poor are being publicized, China is also beefing up its internal security forces and clamping down on foreign media outlets.

An Egypt-style mass revolt currently appears unlikely to break out in China. However, this has been a year full of the "impossible" happening. Investors, keep your eyes open.

Also in the news

1) OIL SPIKE: Oil jumps to near $107 in Europe to fresh 2-year highs as Libya conflict intensifies.

2) RECORD U.S. DEFICIT : The federal government posted its largest monthly deficit in history in February at $223 billion.

3) DUSTBOWL II?: U.S. farmers fear a return of the Dust Bowl...

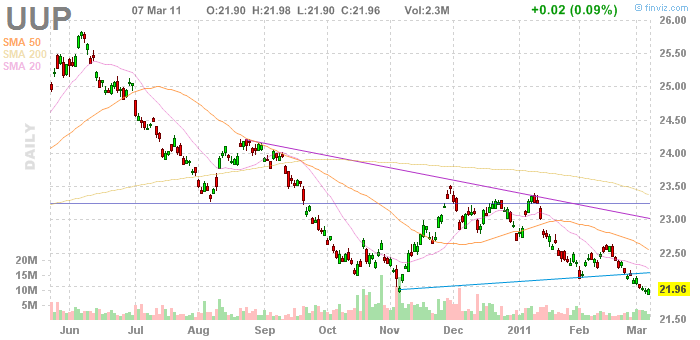
4) SHORTING THE DOLLAR: More FX traders are shorting the dollar as the currency continues to fall out of favor.

5) METAL MANIA: Gold and silver will just not stop... as gold is now nearing an all-time record of $1,445, while silver hits 31 year high, crossing well past the $36 mark.

Finally... Gasoline prices have staged their second biggest two week price increase in history, jumping 33 cents in the last two weeks... The current national average price of $3.51 is 61 cents below the all-time high price recorded in July 2008.

Rising Oil - Rogers Forecasts $2,000 Gold

The yellow metal was slightly higher today. All eyes are on oil.

Oil prices went above $105 and could rally further on:

  • Intensified fighting in Libya
  • Investors worried about a protracted export suspension in Libya
  • Political contagion in the Middle East, a region with more than 60% of the world’s proven oil reserves
  • Morgan Stanley (MS) ceases oil trading with Libya. Exxon, Marathon Oil and Conoco have either cut off or greatly reduced dealings in order to comply with U.S. sanctions.

Jim Rogers reiterated his bullishness in the precious metals raised question regarding Saudi’s oil reserves.

“Gold will go to $2000 in this decade. It’s pretty simple as far as I’m concerned. Silver will certainly go over $50. The old high on silver was $50. Silver will go to new highs again. All these prices are going to go to absurd levels by the end of the decade, by the end of the bull market.”

"Saudi Arabia has been lying about their (oil) reserves for decades. The reason oil is going up is the world is running out of known reserves of oil.”

We had an article on Saudi Arabia last week and also mentioned in gold price forecast page. To follow up, the country is drafting up to 10,000 security personnel into its north-eastern Shia Muslim provinces, clogging the highways into Dammam and other cities with busloads of troops in fear of March 12 "day of rage" by what is now called the "Hunayn Revolution".

While Libya and the social unrest in the Middle East can raise prices of gold and oil much further, a US dollar comeback will put both PM’s and stocks under pressure.

dollar trend

97% of All U.S. Mortgages are Backed by the Government

I heard a recent talk by Richard Wolff - Professor of Economics Emeritus at the University of Massachusetts in Amherst (PhD in Economics from Yale) - where Wolff said that 97% of all U.S. mortgages are either written or guaranteed by the government.

As Bloomberg explained last August:

Fannie Mae and Freddie Mac, the government-controlled companies that issued and guaranteed more than 71 percent of mortgage-backed bonds last year. Between those companies and Ginnie Mae, which guarantees loans insured by the Federal Housing Administration, the government backed nearly 97 percent of U.S. mortgages in 2009.
And Dwight M. Jaffee, Lawrence J. White, Peter Wallison, Arnold Kling, Anthony B. Sanders, Michael Lea note:
During 2009 and 2010, GSEs guaranteed as much as 70 percent of mortgage market activity. Other government programs guaranteed an additional 25 percent.
There are supposedly plans in Washington to wind down Fannie and Freddie. Critics say that would destroy the "recovery" in housing.

If continuing to throw money at Fannie and Freddie would stabilize the economy, I might be for it - even though it is not free market capitalism. I am not wed to either liberal or conservative ideologies, and am instead simply motivated to do whatever will work to stabilize the economy and help the most people.

But as I noted in January:

Most independent experts say that the government's housing programs have been a failure. That's too bad, given that the housing slump is now - according to Zillow's - worse than during the Great Depression.

Indeed, PhD economists John Hussman and Dean Baker, fund manager and financial writer Barry Ritholtz and New York Times' writer Gretchen Morgenson say that the only reason the government keeps giving billions to Fannie and Freddie is that it is really a huge, ongoing, back-door bailout of the big banks.

Many also accuse Obama's foreclosure relief programs as being backdoor bailouts for the banks. (See this, this, this and this). (more)

Thinking About Municipal Bonds?


Technical analyst Chris Kimble shares his views on Munis with a look at the iShares S&P National AMT-Free Municipal Bond Fund (MUB).

As Silver Continues to Soar, This Miner Is Just Beginning Its Monumental Move: CDE

By John Townsend, The TSI Trader


Coeur D’alene Mines Corp (CDE:NYSE $34.70) is just beginning its monumental move. I believe we may see its share price double in the next 8 – 12 weeks.

This article will provide you with an update of silver’s current parabolic move; detail the underpinnings of Coeur D’alene’s incredibly strong fundamentals going forward into 2011, and expose the powerfully bullish technical outlook for its stock.

Click on the chart to ENLARGE

Silver is presently making its fifth parabolic appearance of this secular bull market for precious metals. Our first chart is a weekly look at the World Silver Index (XSLV) dating back to 2004 and including the three previous silver parabolic moves of 2004, 2006 and 2008. The 40 week moving average is shown as a proxy for the 200 day moving average.

One of the metrics to observe is the degree to which a silver parabolic ultimately rises above its underlying 200 dma. Another consideration is the length of consolidation time that precedes the parabolic move. When I combine these two metric considerations and apply them to our current silver parabolic, it is apparent that silver’s price rise above its 200 dma could match or exceed 65%. This projects a silver peak in excess of $50. In fact, as the consolidation preceding our current parabolic has been massive, $50, in retrospect, may turn out to have been too conservative.

This second weekly chart of XSLV considers our current parabolic using a different metric – the midpoint consolidation. There is a tendency for parabolic moves to exhibit a resting point that divides the move into two equal legs. And we observe that silver has now cleared its consolidation phase at the $32 level and is headed towards a completion of this pattern at $48.


Click on the chart to ENLARGE

The takeaway from these observations is not to argue just how high silver will soar, but to simply note that silver is going much higher, quickly and now.


Coeur D’alene (CDE) is poised fundamentally to skyrocket right along with silver. The company has three mines that are now in full production and the 2010 Q4 results announced last week revealed that analysts were significantly underestimating the company’s new earnings power. Analysts expected the company to earn 33 cents per share and instead the company reported quarterly earnings of 56 cents per share.


Some highlights of Coeur D’alene’s key fundamental data include: $3 Billion market capitalization, shares outstanding 89 Million and holding flat, selling at 1.5X book value, 2011E Price to Earnings ratio of 12 (which is about half the average PE of other large silver miners), and 2011E Price to Cash Flow ratio of 7 (also about half the average of comparables).


Consensus estimated earnings for 2011 are $2.28 per share vs. 2010 $0.39 actual earnings per share. Cash flow from operations (chart below from the Coeur D’alene website) is expected to more than double in 2011 from 2010.

Click on the chart to ENLARGE

Debt levels are trending downward quarter after quarter while cash levels are trending strongly upwards. For 2011 the company projects that capital expenditures will decline, while production of both silver and gold will increase, as will sales.


Regarding the issue of hedging the CEO, Dennis Wheeler, commented during last week’s conference call, “I just want to make it clear that Coeur has the policy of non-hedging in silver production. We know that our investors like you are believers in the continued price appreciation of silver and gold and we want our investors to be able to maximize their investment and leverage to the metal so we will not be hedging any of our silver”.

To summarize current and projected CDE fundamentals, it is somewhat difficult for me to imagine a more ideal setup. Projected earnings and cash flow growth are explosive, current market valuations in terms of book value, price to earnings and price to cash flow are in the silly cheap category, and last quarter’s performance puts the sting to any who may have doubted Coeur D’alene’s ability to deliver. I should add that ownership of CDE shares is literally a list of the ‘who’s who’ of investment heavyweights – ETFs GDX and GDXJ, as well as Van Eck, Dimensional, Vanguard, State Street, JP Morgan Chase and Blackrock.


The following weekly chart of CDE reveals that several months ago stock price broke above a 5 year long down trend resistance line, has since consolidated above this line after a successful retest, and is now continuing higher.

Click on the chart to ENLARGE

The chart also details the significance of the $28 price level which was a support level for CDE price from 2004-2008 and has since 2008 been a resistance level. Until last week that is, when CDE took on that $28.00 price level and blasted right through it, closing the week at $34.70. Technically speaking, this is the recipe for beginning a monumental move.

The 2004 and 2006 silver parabolic moves took CDE from being a $28 stock to the $75 neighborhood and quickly. As I believe the current silver parabolic is likely to surpass the magnitude of each of the four preceding silver parabolics, the fundamental underpinnings of the CDE stock are nothing short of both impressive and ideal, and the technical setup is exactly as one would hope, I consider it a realistic possibility that CDE could again achieve a $75 price target before the current silver parabolic expires.

One final thought with a chart. The overhead resistance (selling pressure) should be reasonably mild as CDE has not traded any shares above $28 for three years or so. Not all, of course, but most sellers of the shares now are sitting with a profit and are not particularly motivated to sell provided price continues higher. And for that matter, this chart shows us that shareholders who bought 4 and 5 years ago are not holding a lot of shares anyway.


Click on the chart to ENLARGE

Disclosure: I own CDE and look forward to participating with CDE throughout the concluding leg of this silver parabolic.

I wish you a great week of trading and invite you to peruse my website, The TSI Trader, where you will find a focus on both the techniques of using the True Strength Index (TSI) indicator for accurate trading signals and the secular bull market for precious metals.

John Townsend

tsiTrader@gmail.com

Dollar May Weaken as Euro Draws Buyers

The U.S. dollar is likely to fall in the week ahead as investors continue to bet that interest rates in the euro zone will rise ahead of those in the world's largest economy.

U.S. February jobs data came in a touch better than expected on Friday but disappointed investors who had hoped for an even stronger report.

Investors see strong U.S. jobs growth as necessary for the Federal Reserve to end its second round of quantitative easing and instead tighten monetary policy by raising rates.

The U.S. situation is in sharp contrast with that of the euro zone, where the zone's common currency is likely to remain supported after European Central Bank President Jean-Claude Trichet strongly hinted at an interest rate rise in April, bolstering the view the ECB will tighten monetary policy before the Fed.

"We had Mr. Trichet warning Thursday that the ECB is considering a rate hike and perhaps the start of a rate hike cycle," said Joseph Trevisani, chief market analyst at FX Solutions in Saddle River, New Jersey. "The U.S. job number came in as expected and provided little direction to the market other than it did not disappoint and that will support risk appetite."

For the week, the euro gained 1.7 percent against the dollar on electronic trading platform EBS, the third straight weekly gain, while the dollar gained 0.8 percent against the yen.

A slew of technical factors also indicate investor caution on the dollar, particularly against the euro.

One-month euro/dollar risk reversals last traded at -1.175 on Friday, according to Reuters data, with a bias toward euro puts and dollar calls, suggesting more investors are betting the euro will fall than will rise.

But that compares with late November when one-month risk reversals posted at -2.83, suggesting negative sentiment on the euro has eased substantially. The euro has already gained more than 6 percent against the dollar since that time.

Those gains pushed the euro/dollar above its 200-week moving average this week for the first time since mid November, piercing a strong long-term resistance level.

There is now little to prevent the euro's rise to $1.4283 on EBS, the November high from which it slid to $1.2860 in January but from which low it has steadily retraced higher. Stamford, Connecticut-based Faros Trading sees the euro making a move to the $1.50 level within the next three months.

Nearer term, the buy signal triggered on Feb. 23 when the 12-day and 26-day moving average convergence divergence line rose above the 9-day signal line is also holding. The MACD is an indicator of short-term momentum by focusing on exponential moving averages and closing prices.

Investors were betting heavily against the dollar ahead of the jobs data and Trichet's comments.

The value of the dollar's net short position rose to $34.9 billion in the week ended March 1 from $22.36 billion a week earlier, according to Commodity Futures Trading Commission data on Friday and Reuters calculations. It was the largest net short dollar position for which Reuters has data, dating back to June 2008.

Net long positions in the euro rose to 51,308 contracts, the highest since January 2008, from 45,598 contracts in the prior week.

The dollar is also seen struggling against the yen as it failed to hold onto its initial gains after the jobs data.

"Bernanke may be relieved to see another month of improvement in the unemployment rate, but given the underlying weakness of the report, the central bank will still argue that unemployment remains extremely high and therefore continued stimulus could be warranted," said Kathy Lien, director of currency research at GFT in New York.

Bets on the yen also jumped to 41,274 contracts, only the largest since November but a big change from the 27,746 short bets last week.

With talk that the Fed may even go for a third round of quantitative easing after the current phase ends in June, strong jobs growth for at least the next three months is consequently key to any dollar revival.

Even ongoing political instability in the Middle East and North Africa and the threat that it may spread to Saudi Arabia, a key U.S. ally in the region and a global oil supplier, could weaken the dollar.

While the dollar has been regarded as a safe haven in times of turmoil, some investors suggest higher oil prices would push other central banks to raise interest rates to counter inflation even as the Fed maintains its stimulative monetary policy, which would again leave investors chasing yield with little choice but to sell the dollar.

CIBC:A Huge Guide To Every Single Rare Earth Deposit In The World

CIBC World Markets have released a complete sector overview of the rare earths space, noting what elements will perform, and what companies are position to take advantage of it.

The crux of the report is that demand for the products that utilize rare earths is increasing. The supply of those elements is now being pinched, by a China willing to export less. Companies are stepping in to provide supply to the market, notably Avalon Rare Metals, Frontier Rare Earths, and Molycorp.

What's important when investing in the space is not just that the company focuses on rare earths, but that it focuses on key, high demand elements. Those elements include neodymium, praseodymium, yttirium, terbium, and dysprosium, according to CIBC, and the aforementioned companies are there to take advantage.

For a walk-through of where demand is, how supply is being pinched, and what companies you should be watching, take a look at these charts.

Click here for the charts >