Sunday, December 15, 2024

Buy the VIX Now?

Now you have to...

Complacency and calm, that is the way to describe the general sentiment in the markets right now and we are hearing more and more "volatility is dead" trades presented. However, never ever forget that volatility is mean reverting. The actual VIX level at its natural floor, combined with the most extreme VIX call skew we have ever seen and several extreme technical positioning indicators, leads us to put on cheap VIX call spreads. To be clear, this is not a call that stocks will crash - this is a call on VIX upside optionality.
The saying is that you should buy VIX when you can, not when you have to - but this time it is slightly different - you have to buy it because the trade is simply too attractive to ignore.

1 - Natural floor

VIX is close to the "modern days" natural floor. Volatility is mean reverting, so don't expect much lower levels of volatility.
Source: Refinitiv
 

2 - VVIX not buying it

The latest gap between VVIX and VIX is very wide. You pay attention to well bid VIX, despite things moving little at the moment.
Source: Refinitiv
 

3 - A record skew

VIX call skew hit all time high of 1.5x (the 3 month 5/50 delta call). Volatility is low, but tails are priced extremely rich. This makes VIX call spreads attractive.
Source: GS/Garrett
 

4 - The puke

VIX specs have puked "it" since the election. They are back to running rather big shorts. Such big changes in specs could become a problem should things start to move again...
Source: Refinitiv
 

5 - The chasers

ETNs are huge buyers of VIX should things get a little less calm. We have seen this movie play out before.
Source: Nomura
 

6 - The Christmas gift

Long VIX under the Christmas tree? We have a few more boring weeks, but VIX seasonality is very strong from mid January. Can you afford to wait?
Source: Equity Clock
 

7 - Hedge fund leverage getting extreme

Many of the positioning indicators we look at are now at extreme levels. We are only showing one here - JPM prime brokerage data showing how net leverage continues to spike. with percentile numbers in the high 90's. This does of course matter for the VIX trade as well - a little less complacency leads to equity selling which leads to higher VIX. It's all inter-connected.
Source: JPM PI

Saturday, November 30, 2024

IWM Will Soar Nearly 70% by the End of 2025

If you want big returns, I'm convinced you'll find them in small caps. When I make bold predictions, and many of you know that I do fairly often, it's usually supported by long-term perspective. Most everyone has a negative bias towards small caps right now, because they've underperformed so badly the past few years. But I use perspective on small caps just as I did in 2022 on the large caps. Let me use the S&P 500 as an example:

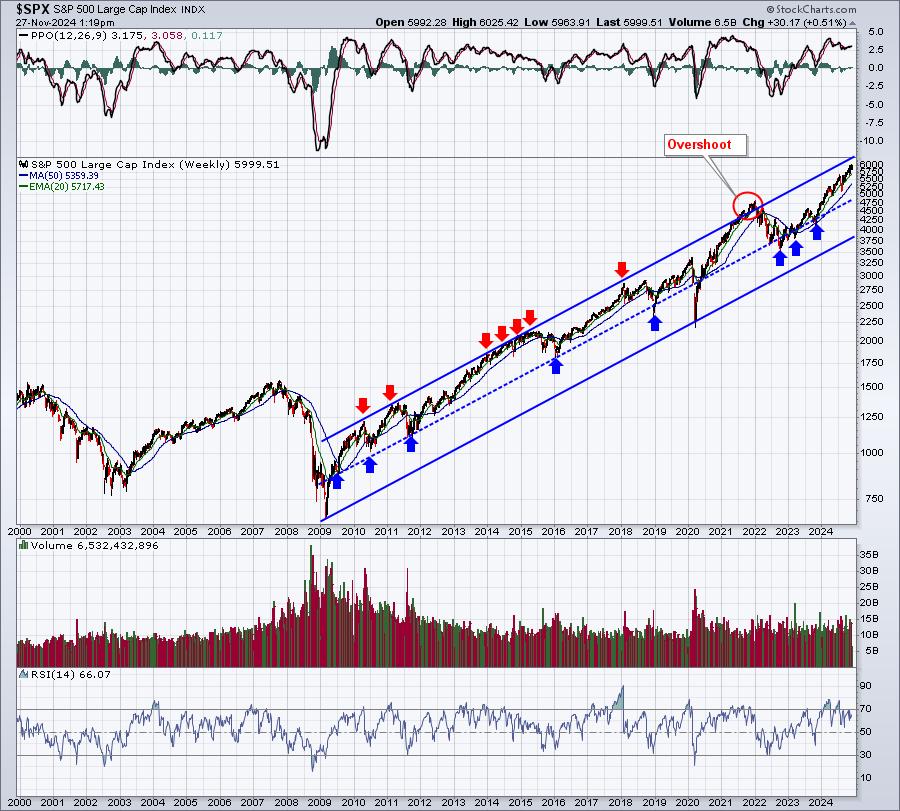
Do you remember how bullish sentiment was at the end of 2021? We had the most complacent readings EVER on the 253-day SMA of the equity only put call ratio. And we had an "overshoot" on the S&P 500 outside of the secular bull market channel. That left the likelihood of little upside and the potential of plenty of downside to test the "middle" channel level where most corrections and/or cyclical bear markets end. At MarketVision 2022 in January 2022, I discussed the very real possibility of a 20-25% cyclical bear market decline to last 3-6 months and this was a chart that supported my theory. There were other reasons as well, but I'm focused in this article on perspective and the benefits of having long-term perspective and not being overcome by short-term recency bias. We actually saw the cyclical bear market drop 28% and last 9 1/2 months. It wasn't a perfect call, but it was pretty darn solid.

Notice that those tests of the blue-dotted "middle" upslope line are excellent opportunities to jump in for what's likely to follow - a strong uptrend to return back to the upper channel line.

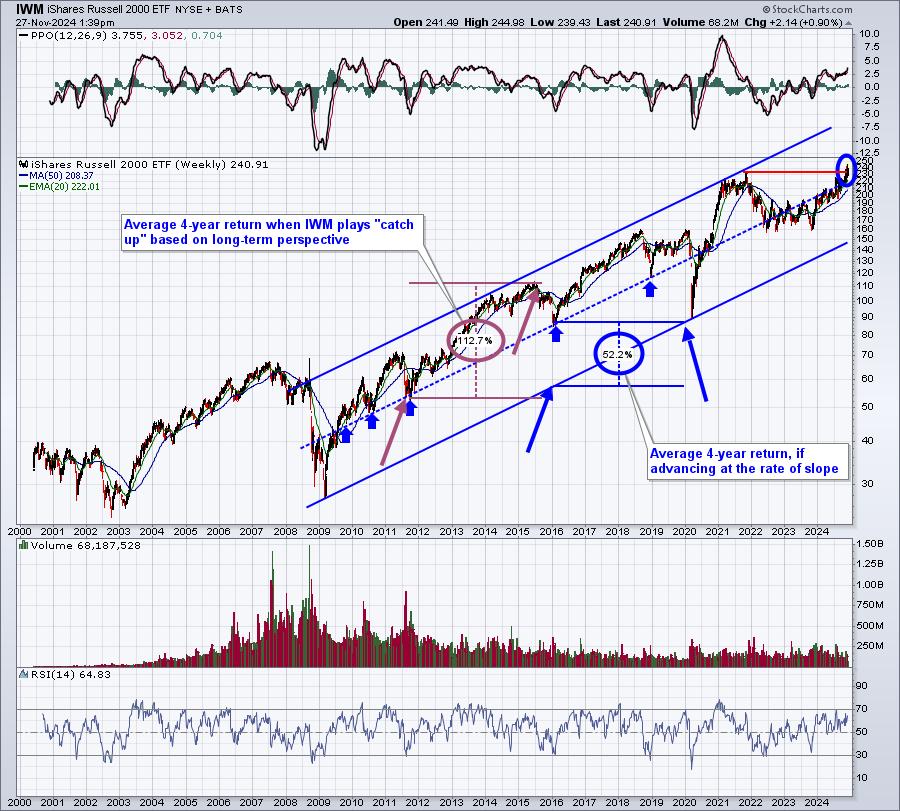
So how does the small cap IWM look right now:

The blue "percentage change" shows 52%, but this is measuring a 4-year period where price action simply follows the bottom of the slope. However, the maroon "percentage change" shows what happens if you increase at a much, more rapid pace from the blue-dotted "middle" upslope line to the upper solid blue upslope line, in this case rising 112% - more than twice the rate if you simply go along for the ride with the slope. I believe the IWM has just begun a very significant rise back towards its upper channel line. I won't be surprised if the IWM hits 400 in 2025, which would represent nearly a 70% return. This type of a move would be no different that what we've seen in the past on both of the above charts.

Again, to make these types of predictions, you have to be willing to ignore what's happened recently (check your recency biases at the door), and focus on what the long-term channel is telling you. Could I be wrong? Absolutely. But I firmly believe small caps will continue the leadership role we've seen of late, significantly outperforming the S&P 500 and NASDAQ 100.