It's a tradition you can rely on — as regular as Thanksgiving or
Christmas, but without the messy cleanup. Yep, it's Predictions Time!
That time of year when we're about to put one in the books and look
forward to a new one...
I don't know if it's just getting older, but Thanksgiving/Christmas
do a better job of sneaking up on me every year. I've barely stopped to
look ahead at holiday schedules.
But holidays are one-off events. The stock market/economy are a
continuum, and so I am always looking at current events and attempting
to get a feel for how they will play out over the months and years
ahead.
As I've said repeatedly, stock market forecasts can be based on one
thing and one thing only: corporate earnings. As I wrote last year: (more)
Saturday, December 5, 2015

Friday, December 4, 2015
Franklin Resources, Inc. (NYSE: BEN)
Franklin Resources, Inc. is a publicly owned asset management holding
company. Through its subsidiaries, the firm provides its services to
individuals, institutions, pension plans, trusts, and partnerships. It
launches equity, fixed income, balanced, and multi-asset mutual funds
through its subsidiaries. The firm invests in the public equity, fixed
income, and alternative markets. Franklin Resources, Inc. was founded in
1947 and is based in San Mateo, California.
Take a look at the 1-year chart of Franklin (NYSE: BEN) below with my added notations:

BEN has hit the $42 mark (red) as resistance multiple times in the past month. In addition, the stock has been climbing a trend line of support (green) since mid-October. Eventually, the stock will have to break either the $42 resistance or the trendline support.
The Tale of the Tape: BEN is winding up between two key levels. A long trade could be made at the trendline support or on a break above $42. A break below trendline would be an opportunity to enter a short trade.
Take a look at the 1-year chart of Franklin (NYSE: BEN) below with my added notations:
BEN has hit the $42 mark (red) as resistance multiple times in the past month. In addition, the stock has been climbing a trend line of support (green) since mid-October. Eventually, the stock will have to break either the $42 resistance or the trendline support.
The Tale of the Tape: BEN is winding up between two key levels. A long trade could be made at the trendline support or on a break above $42. A break below trendline would be an opportunity to enter a short trade.
Gold Capitulation ?
The technical charts on gold are suggesting the start of a fresh leg
lower in price. The loss of chart support near the $1075-$1070 level,
and the subsequent inability of the metal to move back above that level,
has led to both long liquidation on the part of the specs as well as
fresh shorting.
On the intermediate term chart ( Weekly) price appears headed for the lower line of the downtrending price channel that has contained gold since April of 2014. Currently, that targets a potential move to down near $1030-$1020.

As noted in a previous post detailing this weekly chart, the metal has actually formed a new and steeper downtrending channel since March/April of this year. (more)
On the intermediate term chart ( Weekly) price appears headed for the lower line of the downtrending price channel that has contained gold since April of 2014. Currently, that targets a potential move to down near $1030-$1020.
As noted in a previous post detailing this weekly chart, the metal has actually formed a new and steeper downtrending channel since March/April of this year. (more)
Big Moves in All Markets in the Intermarket Grid Dec 3: S&P, Gold, Crude, Bonds, Dollar, Euro
The one-two punch of Mario Draghi’s ECB announcement with the Fed’s
“we’re going to raise rates in December we promise!” statement
contributed in part to big price moves and short-term trend reversals in
all main markets we follow.
Let’s take a quick snapshot of today’s Money Flow grid across six (futures) markets:
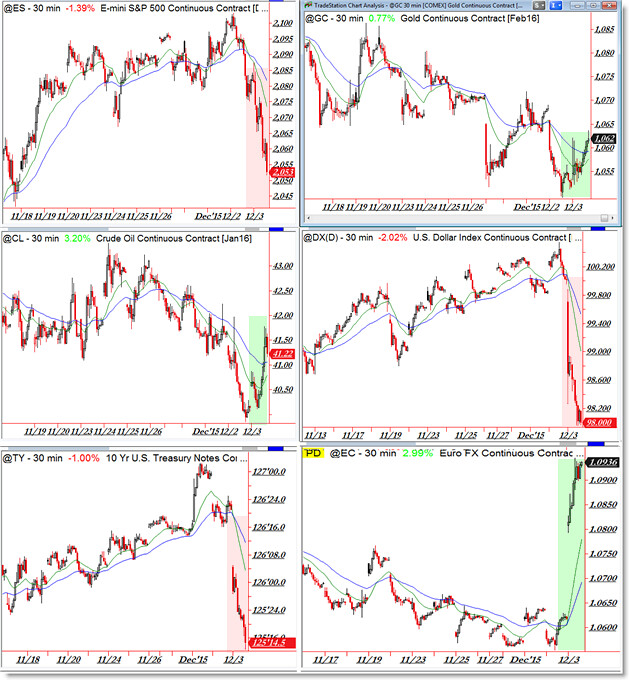
Fundamental news and Central Bank policies aside, let’s focus on the knee-jerk reactions in today’s market.
First, stock prices collapsed, continuing their sell-signal down away from 2,100 (@ES top left chart).
The Dollar Index (@DX – middle right chart) collapsed today, falling from divergences against resistance.
The sudden intraday collapse in the US Dollar instantly boosted most commodities including Gold and Oil.
Chart Gold (@GC) in the upper right and Oil (@CL) in the middle left chart.
The movements here aren’t as dramatic as other markets, as these moves are currently counter-trend retracements.
Finally we see the Euro (@EC bottom right) surging at the same time the Dollar collapsed.
Perhaps the most surprising development today is the instant collapse in Treasury prices as seen via the 10-Year Treasury Note (@TY – lower left).
In sum, we have the Euro surging while commodities rally; US Stocks, the US Dollar, and the US 10-Year Treasury Note collapsed intraday.
Let’s take a quick snapshot of today’s Money Flow grid across six (futures) markets:
Fundamental news and Central Bank policies aside, let’s focus on the knee-jerk reactions in today’s market.
First, stock prices collapsed, continuing their sell-signal down away from 2,100 (@ES top left chart).
The Dollar Index (@DX – middle right chart) collapsed today, falling from divergences against resistance.
The sudden intraday collapse in the US Dollar instantly boosted most commodities including Gold and Oil.
Chart Gold (@GC) in the upper right and Oil (@CL) in the middle left chart.
The movements here aren’t as dramatic as other markets, as these moves are currently counter-trend retracements.
Finally we see the Euro (@EC bottom right) surging at the same time the Dollar collapsed.
Perhaps the most surprising development today is the instant collapse in Treasury prices as seen via the 10-Year Treasury Note (@TY – lower left).
In sum, we have the Euro surging while commodities rally; US Stocks, the US Dollar, and the US 10-Year Treasury Note collapsed intraday.
Thursday, December 3, 2015
6 Hot Stocks Poised For A Short Squeeze: M, IBM, XOM, CLF, SQ, FIT

This week’s Astec Analytics' top pick from a securities lending perspective was Macy's, Inc. M
Other stocks that that saw plenty of short-selling activity included the following:
- International Business Machines Corp. IBM
- Exxon Mobil Corporation XOM
- Cliffs Natural Resources Inc CLF
- Square Inc SQ
- Fitbit Inc FIT
SolarCity Corp (NASDAQ:SCTY)

SolarCity Corp (NASDAQ:SCTY) As you can see on the daily technical chart above, stock has clearly been showing relative strength in the last couple trade sessions. If it breaks the key resistance line of 34.65, it should easily go to next price resistance around 38. The momentum indicators are also not overbought on daily, implying scope for further upsides. On watch.
Wednesday, December 2, 2015
Valeant Pharmaceuticals Intl Inc (NYSE:VRX)

Extremely bullish moves on Valeant Pharmaceuticals Intl Inc (NYSE:VRX) are taking place over the last few days. Today, the stock jumped 9.80% with good volume closing near the $100 mark. The daily technical indicators are looking bullish. This momentum could push this stock much higher from here, so keep it on the radar.
Subscribe to:
Posts (Atom)