Someone just dumped a bucketload of VRX...(more)
Thursday, October 22, 2015
Will These Stocks Plunge Next? : $VRX, $APD, $MDLZ, $PAH, $ZTS, $QSR, $VRX
With Valeant having collapsed over 30% today alone, now under $100 for the first time in a year (from highs over $260 in August 2015):

Someone just dumped a bucketload of VRX...(more)
The Key SP500 Price Pivot Planning Level to Trade
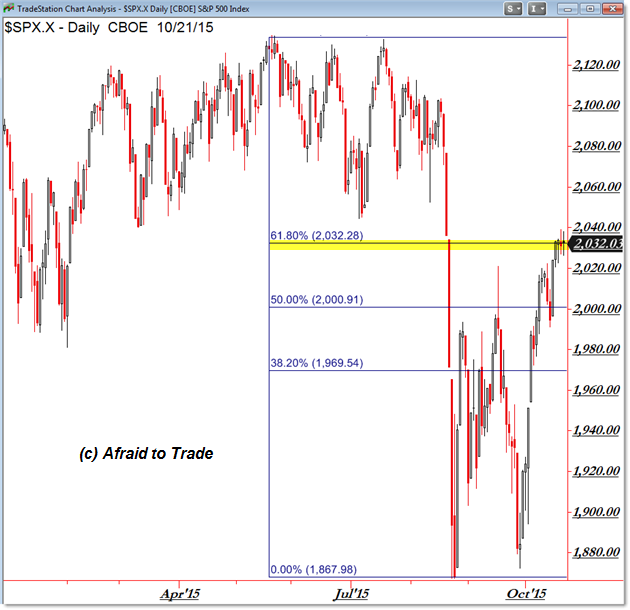
What’s the current major “Bull/Bear” Pivot Price for the S&P 500? On what level should we be focusing?
Let’s take a laser-like focus on this price level and plan our strategy for the rest of the week.
Here’s the simple pivot in the S&P 500:

Our key focal point is 2,033 (technically 2,030 to 2,040) for this week’s bull/bear pivot planning.
This level reflects the 61.8% “last line in the sand” Fibonacci Retracement of the August collapse and recovery.
Ultimately, what happens here determines whether we are “ignore it all” buyers (bulls) above 2,040 or cautiously bearish, anticipating another pullback from resistance. (more)
Let’s take a laser-like focus on this price level and plan our strategy for the rest of the week.
Here’s the simple pivot in the S&P 500:

Our key focal point is 2,033 (technically 2,030 to 2,040) for this week’s bull/bear pivot planning.
This level reflects the 61.8% “last line in the sand” Fibonacci Retracement of the August collapse and recovery.
Ultimately, what happens here determines whether we are “ignore it all” buyers (bulls) above 2,040 or cautiously bearish, anticipating another pullback from resistance. (more)
Stocks to Watch: $CAM, $AAPL

Cameron International Corporation
(NYSE:CAM) is setting up for another run. Lets see if it breaks over
$67.61. Long set-up on watch.

Apple Inc. (NASDAQ:AAPL) could breakout at any moment IMO Next buy point when clears 117 on heavy volume. The MACD momentum is rising and RSI is on a decent uptrend, which when combined with the strengthening MACD could spell a nice move for the stock.
Dycom Industries, Inc. (NYSE: DY)
Dycom Industries, Inc. provides specialty contracting services in the
United States and Canada. The company offers a range of specialty
contracting services, such as engineering, construction, maintenance,
and installation services comprising placement and splicing of fiber,
copper, and coaxial cables to telecommunications providers. It also
provides underground facility locating services, including locating
telephone, cable television, power, water, sewer, and gas lines to
various utilities, which comprise telecommunications providers. In
addition, the company offers tower construction, lines and antenna
installation, and foundation and equipment pad construction services for
wireless carriers, as well as equipment installation and material
fabrication, and site testing services; and installs and maintains
customer premise equipment, such as digital video recorders, set top
boxes, and modems for cable television system operators.
Take a look at the 1-year chart of Dycom (NYSE: DY) below with my added notations:

DY has hit resistance at $80 (red) multiple times over the past couple of months. In addition, the stock has been climbing a trend line of support (green) since the beginning of September. Eventually, the stock will have to break either the $80 resistance, which would be a 52-week high, or the trendline support.
The Tale of the Tape: DY is winding up between two key levels. A long trade could be made at the trendline support or on a break above $80. A break below trendline would be an opportunity to enter a short trade.
Take a look at the 1-year chart of Dycom (NYSE: DY) below with my added notations:
DY has hit resistance at $80 (red) multiple times over the past couple of months. In addition, the stock has been climbing a trend line of support (green) since the beginning of September. Eventually, the stock will have to break either the $80 resistance, which would be a 52-week high, or the trendline support.
The Tale of the Tape: DY is winding up between two key levels. A long trade could be made at the trendline support or on a break above $80. A break below trendline would be an opportunity to enter a short trade.
Wednesday, October 21, 2015
Netflix $NFLX: The Most Overvalued Value on the Street
Netflix (NFLX) stock slapped the bulls in the face last week, or did it?
The company announced that it had fallen short of Wall Street earnings estimates by a penny when it earned 7 cents per share for the latest quarter.
As we all know by now, the stock immediately shed about 10% to trade back to $100, where it sits just below now.
So the question is, do you buy, hold or sell from here? (more)
The company announced that it had fallen short of Wall Street earnings estimates by a penny when it earned 7 cents per share for the latest quarter.
As we all know by now, the stock immediately shed about 10% to trade back to $100, where it sits just below now.
So the question is, do you buy, hold or sell from here? (more)
Skechers USA Inc (NYSE: SKX)
Skechers U.S.A., Inc. designs, develops, markets, and distributes
footwear for men, women, and children, as well as performance footwear
for men and women under the Skechers GO brand name worldwide. It
operates through four segments: Domestic Wholesale Sales, International
Wholesale Sales, Retail Sales, and E-commerce Sales. The company offers
casual footwear, including boots, shoes, and sandals for men, as well as
oxfords and slip-ons, lug outsole and fashion boots, and casual sandals
for women; dress casuals, seasonal sandals and boots, and relaxed fit
casuals for men and women; casual fusion line for young men and women
under the Skechers USA brand.
Take a look at the 1-year chart of Skechers (NYSE: SKX) below with my added notations:

SKX has formed an important support level at $40 (green) over the past three months. In addition, the stock is declining against a short-term, down trending resistance level (red). These two levels combined have SKX stuck within a common chart pattern known as a descending triangle. Eventually, the stock will have to break one of those two levels.
The Tale of the Tape: SKX is within a triangle formation. A short trade could be made on a break of support or on a test of resistance. A long trade could be made at support or on a break through the triangle resistance.
Take a look at the 1-year chart of Skechers (NYSE: SKX) below with my added notations:
SKX has formed an important support level at $40 (green) over the past three months. In addition, the stock is declining against a short-term, down trending resistance level (red). These two levels combined have SKX stuck within a common chart pattern known as a descending triangle. Eventually, the stock will have to break one of those two levels.
The Tale of the Tape: SKX is within a triangle formation. A short trade could be made on a break of support or on a test of resistance. A long trade could be made at support or on a break through the triangle resistance.
Twitter $TWTR Stock Could Fly 30% Higher
Twitter Inc (TWTR) — I recommended TWTR stock as the Oct. 9 Trade of the Day
based on a bullish chart pattern, along with the company’s ability to
double its revenues since its November 2013 IPO and finally turn a
profit.
On Oct. 13, the social media company announced it would lay off up to 336 employees, or about 8% of its workforce. New management said the restructuring is part of a plan to increase efficiency and savings will be invested in growth areas.
Twitter also preannounced it expected Q3 revenue and earnings to meet or exceed the high end of its previously projected range. The company is scheduled to report quarterly results on Oct. 27.
The news prompted S&P Capital IQ Equity Research to reiterate its “strong buy” on TWTR stock.
As I mentioned earlier this month, shares completed a “W” double-bottom reversal from a bear market that began in late April at over $55.
Following my buy recommendation, TWTR stock broke from the “W” into a bullish “flag.” The top of the flag is at Monday’s high at $31.60. The formation is supported by higher-than-average buying volume and very low selling volume.
Initial resistance is at the 200-day moving average at $37.70. If the company delivers a strong earnings report next week, we can expect this resistance level to be pierced.
Buy TWTR stock at the market with a short-term trading objective of $40 for a potential gain of almost 30%. Traders should enter a stop-loss order at $28.
Investors may also want to buy shares as a long-term hold in the information technology sector.
On Oct. 13, the social media company announced it would lay off up to 336 employees, or about 8% of its workforce. New management said the restructuring is part of a plan to increase efficiency and savings will be invested in growth areas.
Twitter also preannounced it expected Q3 revenue and earnings to meet or exceed the high end of its previously projected range. The company is scheduled to report quarterly results on Oct. 27.
The news prompted S&P Capital IQ Equity Research to reiterate its “strong buy” on TWTR stock.
As I mentioned earlier this month, shares completed a “W” double-bottom reversal from a bear market that began in late April at over $55.
Following my buy recommendation, TWTR stock broke from the “W” into a bullish “flag.” The top of the flag is at Monday’s high at $31.60. The formation is supported by higher-than-average buying volume and very low selling volume.
Initial resistance is at the 200-day moving average at $37.70. If the company delivers a strong earnings report next week, we can expect this resistance level to be pierced.
Buy TWTR stock at the market with a short-term trading objective of $40 for a potential gain of almost 30%. Traders should enter a stop-loss order at $28.
Investors may also want to buy shares as a long-term hold in the information technology sector.
Subscribe to:
Posts (Atom)

