Thursday, July 9, 2015

Crude Oil and the Canadian Dollar


Today oil took another drubbing with most other commodities, as the slowing global economy met systemic shocks from collapsing speculative frenzy in China and a surprise “No” in Greece. As dramatic as drops have been so far, it is possible that mean reversion trends here are just getting started.
As shown in this long term chart of West Texas Crude since 1990, a retest of the 2009 lows for crude below $40 is well within reason.  Now that oil is firmly below the secular bull channel that supported it since 2001, a break below the prior cycle low of $37 in 2009 would confirm a fresh secular bear that can weigh on prices and producers for years.
WTIC June 30 2015
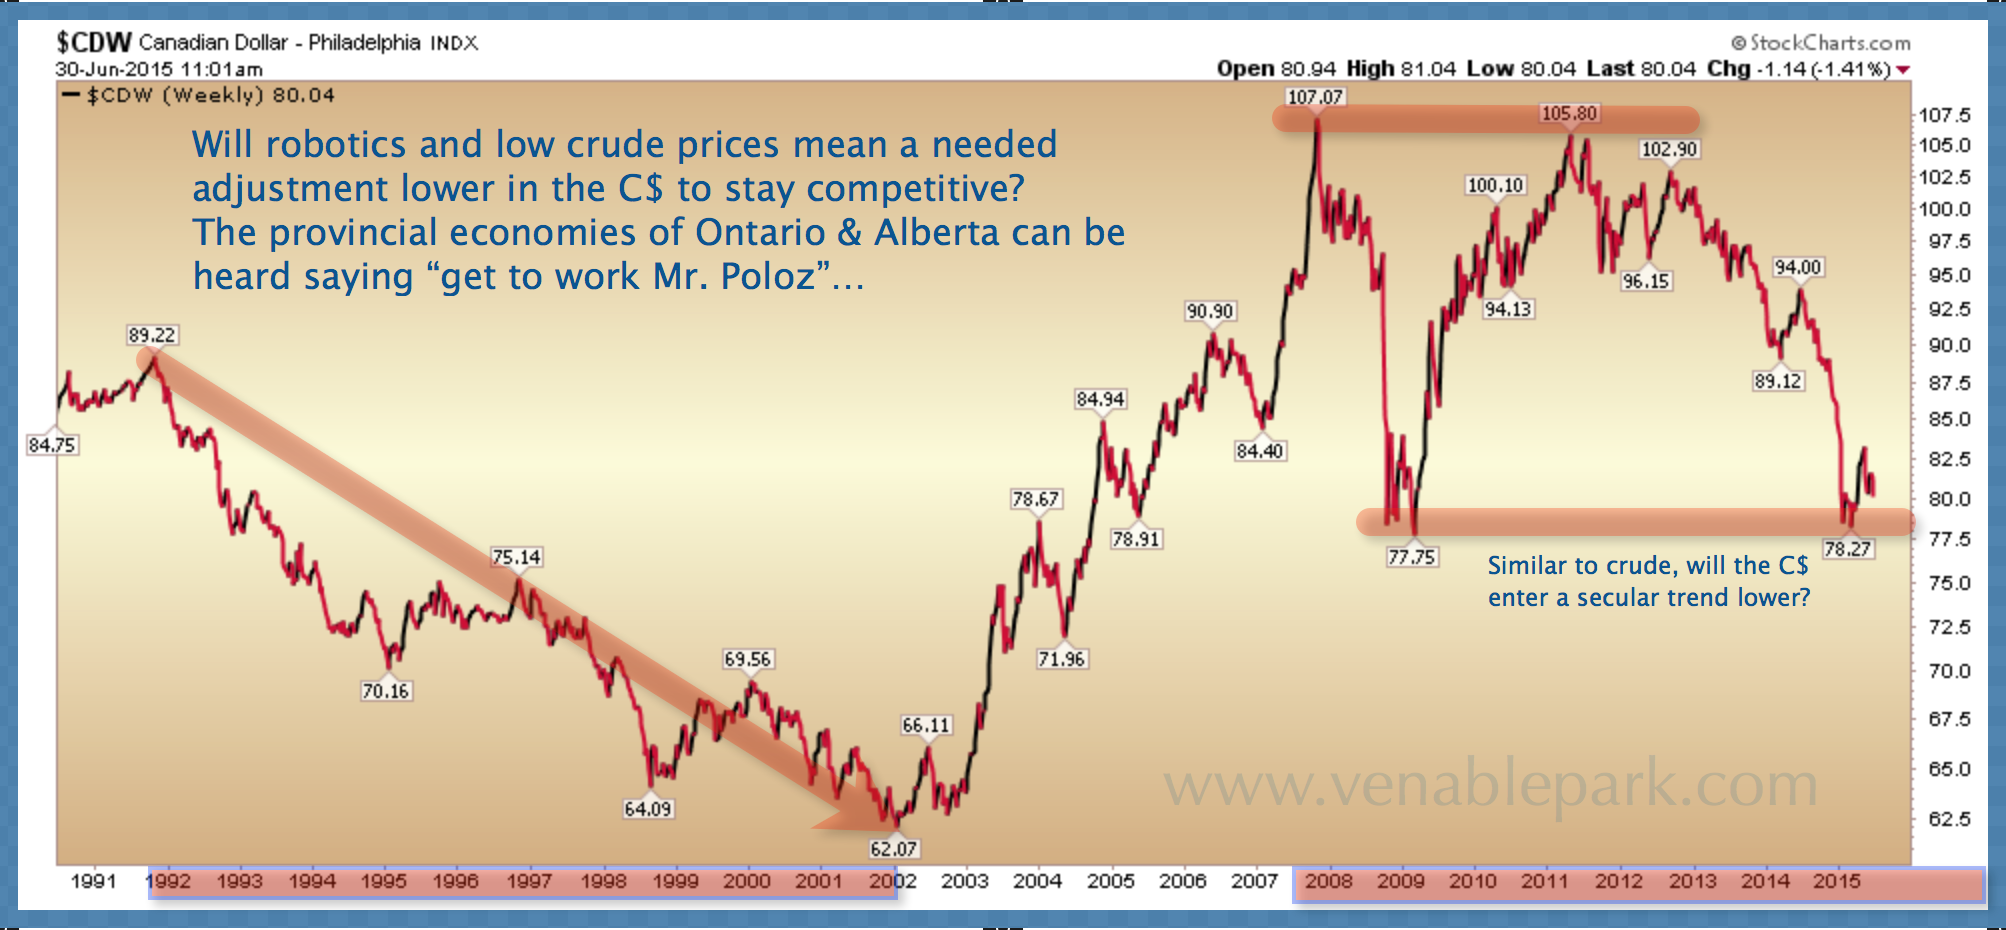
The Canadian (and Aussie) dollar dumped along for the ride as short sellers renewed bearish bets on commodity centric economies and odds increased that the Bank of Canada will cut rates again this month.  See:  Would Stephen Poloz risk ‘inflaming’ Canada’s housing and debt with another rate cut.   Unfortunately, the answer is yes, because all central banks ever had to work with was cutting rates as a tool to encourage risk-taking. But because they used that prod repeatedly and recklessly for the past 15 years,  it is virtually impotent now.  The greatest effect is likely on the currency.  The loonie could easily dive toward the .70U$ area in the process (as shown below).
C$ June 30 2015
Please share this article

TSLA Stock – Has Tesla Topped Out?

Tesla Motors (TSLA) continues to prove naysayers wrong, with TSLA stock sitting on a 16% gain year-to-date despite talk of overblown valuations and production bottlenecks.

But lately, the success of Tesla stock has started to show some strain.

TSLA stock is down about 5% in the last few days in part because of a downgrade from Deutsche Bank[2] from “buy” to “hold” on fears that most of the success is baked into shares.

Of course, at the same time, DB raised its target from $245 to $280 and expressed optimism over Tesla’s battery technology. So it wasn’t all bad. (more)

Please share this article

M.D.C. Holdings, Inc. looks ready to break out of a short-term bullish flag

M.D.C. Holdings, Inc. (MDC) — This U.S. homebuilder sells under the name Richmond American Homes and specializes in single-family residences for first-time and first-time move-up buyers.
It is relatively small compared with its peers. In 2014, it was the 11th largest in the industry based on revenues of $1.7 billion and 12th largest when measured by the number of homes delivered.
Despite a slowdown in its construction levels recently, analysts at Capital IQ believe the company is positioned to benefit from the continued housing recovery. They note its ability to control costs, strong balance sheet and well-placed markets put it in a position to increase revenues and earnings. For 2015, they estimate earnings will increase 25% to $1.61 per share, and then rise another 13% in 2016 to $1.82.
Technically, MDC stock broke from a saucer consolidation that took nine months to form. The breakout was preceded by several strong buy signals from my proprietary indicator, the Collins-Bollinger Reversal (CBR), before smashing through the resistance (now support) at $29.
Shares are currently consolidating in a short-term bullish flag and should break to a new 52-week high within days.
The MACD indicator is on a minor sell signal, but that should be ignored in light of current overall market volatility.
Buy MDC stock at $30.50 for a trade to $35, which would result in a 15% return. Investors should also consider this stock for participation in the home construction industry since its long-term target is estimated to be in the $40s. In addition to its appreciation potential, the company pays an annual dividend of $1 for a current yield of 3.3%.

Knowles Corp (NYSE: KN)

Knowles Corporation designs, manufactures, and sells products and components to the mobile communications, consumer electronics, medical technology, telecommunications infrastructure, military, aerospace, and industrial markets worldwide. The Mobile Consumer Electronics segment designs and manufactures acoustic products, including microphones, speakers, receivers, and integrated modules for the handset, tablet, and other consumer electronic markets. The Specialty Components segment designs and manufactures electronic components used in medical and life science applications; and solutions and components used in communications infrastructure and various other markets.
Take a look at the 1-year chart of Sanderson (NYSE: KN) below with my added notations:
1-year chart of Sanderson (NYSE: KN)
KN has formed a key support level at $18.00 (green) over the past 9 months. Although the stock has dipped below that level a few times, it always rallies back up to hold that mark. In addition, the stock is declining against a short-term, down trending resistance level (red). These two levels combined had KN stuck within a common chart pattern known as a descending triangle. Eventually, the stock will have to break one of those two levels.

The Tale of the Tape: KN is sitting at its triangle support. A short trade could be made on a break of support or on a rally up to resistance. A long trade could be made at support or on a break through the triangle resistance.
Please share this article

Wednesday, July 8, 2015

Chart of the Day Affimed Therapeutics (AFMD)

The Chart of the Day belongs to Affimed Therapeutics (AFMD).  I found the pharmaceutical stock by using Barchart to sort the All Time High list for the stocks having the highest technical buy signals, then used the Flipchart feature to review the charts.  Since the Trend Spotter signaled a buy on 4/9 the stock gained 78.23%.

Affimed Therapeutics B.V. is a clinical-stage biopharmaceutical company. It is focused on discovering and developing cancer immunotherapies. Its product candidates are being developed in the field of immuno-oncology. The Company's TandAbs has the ability to bring NK-cells or T-cells into proximity and trigger a signal cascade that leads to the destruction of cancer cells. Its product pipeline includes AFM13, AFM11 and AFM21. Affimed Therapeutics B.V. is headquartered in Heidelberg, Germany.

technical indicators:
  • Trend Spotter buy signal
  • Above its 20, 50 and 100 day moving averages
  • 7 new highs and up 19.36% in the last month
  • Relative Strength Index 74.21%
  • Barchart computes a technical support level at 13.68
  • Recently traded at 14.49 with a 50 day moving average of 10.54
Fundamental factors:
  • Market Cap $347.47 million
  • Revenue expected to grow 92.10% this year and another 77.40% next year
  • Earnings estimates for the next 5 years have not been projected
  • Wall Street analysts issued 3 strong buy and 1 buy recommendation on the stock
The 20-100 Day MACD Oscillator has been an effective technical trading strategy for this stock.
Please share this article

Man Who First Predicted Greek Bank Deposits Would Be Stolen Now Says Another Terrifying Global Collapse Is Imminent

kingworldnews.com / July 07, 2015
Today the man who first predicted Greek bank deposits would be stolen warned King World News that another terrifying global collapse is imminent.
Another Terrifying Global Collapse Is Imminent
James Turk:  “All we need to do is look around, Eric, to conclude that a financial collapse like we saw in 2008 is rapidly approaching. The writing is all over the wall, and it is there for anyone willing to open their eyes….
“The recent nosedive by Chinese stock prices is a red flag, not to mention real estate prices in that country are hanging from a thread and poised to follow stocks in a tailspin as investors look for liquidity and safety. 
Then of course there is Greece, and more generally, the problems of weak economies and heavy debt loads in the eurozone as well as in other heavily indebted welfare states outside of Europe.
READ MORE
Please share this article

GlaxoSmithKline plc (NYSE: GSK)

GlaxoSmithKline plc creates, discovers, develops, manufactures, and markets pharmaceutical products, including vaccines, over-the-counter medicines, and health-related consumer products worldwide. The company offers pharmaceutical products in the therapeutic areas, including respiratory, anti-virals, central nervous system, cardiovascular and urogenital, metabolic, anti-bacterials, and emesis, dermatology, rare diseases, immuno-inflammation, vaccines, and HIV. It also provides consumer healthcare products in wellness, oral health, nutrition, and skin health areas.
Take a look at the 1-year chart of Glaxo (NYSE: GSK) below with my added notations:
1-year chart of Glaxo (NYSE: GSK)
GSK has been trending lower for the past 4 months. Over that time, the stock has formed an important trend line of resistance (red). Any (2) points can start a trend line, but it’s the 3rd test and beyond that confirm its importance. GSK obviously has an important trendline of resistance, which currently sits right around $43. The stock appears to be on its way down to its $40 support (green).

The Tale of the Tape: GSK is currently stuck under a down trending resistance. A break above that resistance should mean higher prices, thus a long trade could be made either then, or on a fall to the $40 support. Short traders might look to enter a trade at the resistance.
Please share this article