Friday, January 30, 2015

The Guerrilla Economist / 2015: Year of the Great Collapse


Please share this article

Man Who Predicted Collapse Of Euro Against Swiss Franc Issues Third Terrifying Warning To The World

from King World News
Today the man who 59 days ago remarkably predicted the collapse of the euro against the Swiss franc just issued a third terrifying warning to the world. This King World News interview takes a trip down the rabbit hole of massive chaos, panic and wealth destruction, as well as a frightening monster that has been unleashed on the world.
Egon von Greyerz: “Eric, as you know I’ve had a long-standing forecast — for over 10 years — that gold will reach $10,000 in today’s money. I’m also convinced that in the future the world won’t have anything resembling today’s money because of all the money printing that will take place as well as the accompanying hyperinflations….
Continue Reading at KingWorldNews.com…

Please share this article

Carter’s, Inc. (NYSE: CRI)

Carter’s, Inc. and its subsidiaries design, source, and market branded children’s wear under the Carter’s, Child of Mine, Just One You, Precious Firsts, OshKosh, and other brands. The company operates through five segments: Carter’s Wholesale, Carter’s Retail, OshKosh Retail, OshKosh Wholesale, and International.
Take a look at the 1-year chart of Carter (NYSE: CRI) with the added notations:
1-year chart of Carter (NYSE: CRI)
CRI has created a simple chart pattern known as a symmetrical triangle. Combining a down trending resistance (blue) with an up trending support (red) forms the triangle pattern. As the support and resistance converge on each other the pattern is created. Since there is no way to know which way the stock will break, most traders will wait for the breakout, or breakdown, before entering a trade.

The Tale of the Tape: CRI has formed a simple symmetrical triangle. A trader could enter a long position on a break above the down trending resistance (near $86) with a stop set under the entry level. However, if CRI were to break below the trend line support (currently at $83), a short trade could be entered with a stop above the trend line.
Please share this article

Either Oil Soars Back To $88, Or Energy Stocks Have To Tumble By Over 40%

Several days ago we showed something remarkable: “current forward 12-month P/E ratio for the Energy sector is now well above the three most recent historical averages: 5-year (12.0), 10-year (11.9), and 15-year (13.6). In fact, this week marked the first time the forward 12-month P/E for the Energy sector has been equal to (or above) 22.4 since April 8, 2002. On that date, the closing price of the Energy sector was 225.15 and the forward 12-month EPS estimate was $10.05.”

Further refining this analysis and using the S&P Energy Sector Index data, the sector’s forward multiple is now an absolutely ridiculous, mindblowing 23x, the highest since 2002, having soared by nearly 100% in just the past few months as a result of collapsing energy sector earnings.
READ MORE
Please share this article

Thursday, January 29, 2015

Is This Crisis About To Send The World Into Turmoil?


kingworldnews.com / January 28, 2015
As the crude oil market continues to struggle and worries about Europe intensify, today one of the legends in the business sent King World News a warning about a developing crisis that could send Europe and the world into turmoil.
Portion of Art Cashin’s note today: Greek Markets In Turmoil – Things in Athens continue borderline chaotic.  The Greek stock market is down the equivalent of 2500 Dow points since Friday.  Here’s a nice synopsis from my friend Peter Boockvar over at the Lindsey Group:
Any thought of pragmatism from the newly elected Greek government is quickly being thrown out the window. But, when you elect Marxists, this I guess is what you get. Greek capital markets are under major stress again today as they are losing faith that the negotiated process from here on with debts and budgets will go smoothly.
READ MORE
Please share this article

Copper cracks

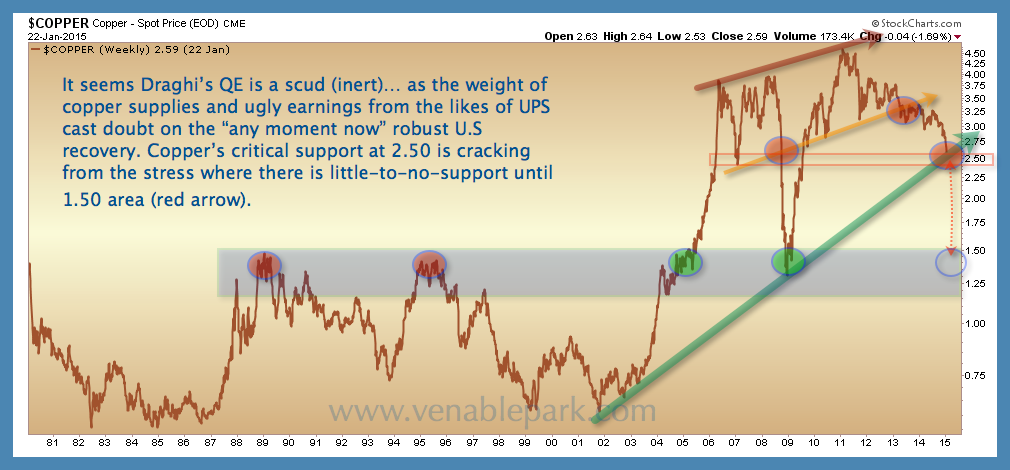
As the bankers keep assuring the world that all is well–why are government bond yields nil to negative and central banks buying up dodgy debts all over the world then?–anyway, as the bankers push the ‘America is a self-sustaining engine of global growth’ meme, Dr. Copper appears to be cracking under the weight of weak demand. Today moving below $2.50 a pound, as it did last entering the 2009 recession, secular support lies some 40% lower in the $1.50/pound range.
Copper Jan 22 2015Please share this article

Microsoft Corporation (NASDAQ: MSFT)

Microsoft Corporation develops, licenses, markets, and supports software, services, and devices worldwide. The company’s Devices and Consumer (D&C) Licensing segment licenses Windows operating system and related software; Microsoft Office for consumers; and Windows Phone operating system. Its Computing and Gaming Hardware segment provides Xbox gaming and entertainment consoles and accessories, second-party and third-party video games, and Xbox Live subscriptions; surface devices and accessories; and Microsoft PC accessories. The company’s Phone Hardware segment offers Lumia Smartphones and other non-Lumia phones. Its D&C Other segment provides Windows Store, Xbox Live transactions, and Windows Phone Store; search advertising; display advertising; Office 365 Home and Office 365 Personal; first-party video games; and other consumer products and services, as well as operates retail stores. The company’s Commercial Licensing segments licenses server products, including Windows Server, Microsoft SQL Server, Visual Studio, System Center, and related Client Access Licenses (CALs); Windows Embedded; Windows operating system; Microsoft Office for business, including Office, Exchange, SharePoint, Lync, and related CALs; Microsoft Dynamics business solutions; and Skype. Its Commercial Other segment offers enterprise services, including premier support services and Microsoft consulting services; commercial cloud comprising Office 365 Commercial, other Microsoft Office online offerings, Dynamics CRM Online, and Microsoft Azure; and other commercial products and online services.
Take a look at the 1-year chart of Microsoft (Nasdaq: MSFT) below with my added notations:
1-year chart of Microsoft (Nasdaq: MSFT)
Over the last 2 months, MSFT has been consolidating between a couple of important price levels. First, MSFT has formed a clear support level at $45 (blue), which was also a key resistance last year. In addition, the stock has also been forming a down trending resistance level (red). These two levels combined have MSFT stuck within a common chart pattern known as a descending triangle that will eventually have to break one way or another.

The Tale of the Tape: MSFT is currently trading within a large descending triangle. A long trade could be made on a break above the down trending resistance or a pullback to $45 support. A short trade could be made on MSFT if the stock breaks below the $45 support level.
Please share this article