Tuesday, November 25, 2014

Energy Transfer Equity (NYSE: ETE)

Energy Transfer Equity, L.P., through its subsidiaries, provides diversified energy-related services in the Unites States. The company sells natural gas to electric utilities, independent power plants, local distribution companies, industrial end-users, and other marketing companies. In addition, it provides natural gas compression services for customer specific systems; and treating services, such as carbon dioxide and hydrogen sulfide removal, natural gas cooling, and dehydration.
Take a look at the 1-year chart of Energy Transfer (NYSE: ETE) below with added notations:
ETE
ETE was on a nice uptrend until October caused the stock to tank. However, just as quickly as the stock fell it rallied right back up again. During the last 3 months the stock had also created a clear level of resistance at $62.50 (green). That resistance level was also a 52-week high resistance. Earlier this week, ETE broke to a new high, and the $62.50 level should now provide support on any pullbacks. A break below $62.50 could signal a false breakout.

The Tale of the Tape: ETE broke out to a new 52-week high. A long trade could be made near $62.50 with a stop placed below that level. A break back below $62.50 would negate the forecast for a continued move higher.
Please share this article

Monday, November 24, 2014

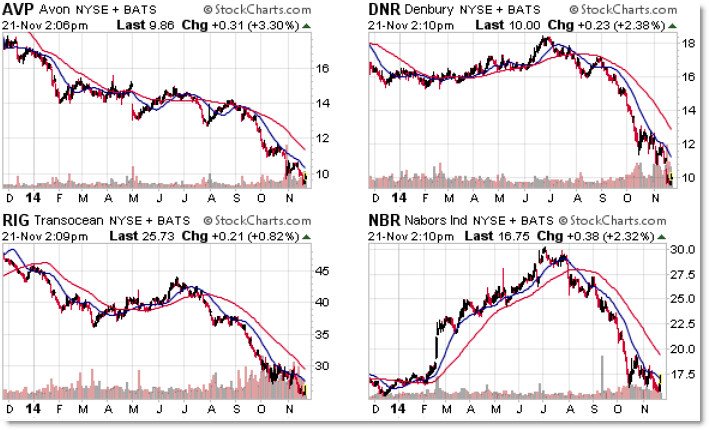
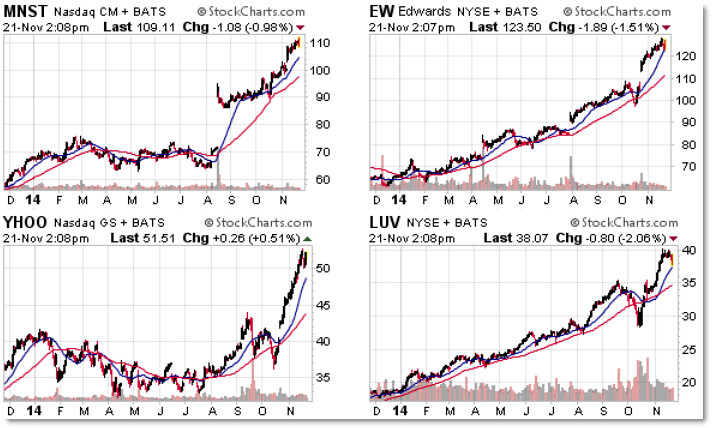
November Stocks Most Extended from 200 SMA: MNST, EW, YHOO, LUV, AVP, DNR, RIG, NBR

Which top trending stocks – both bullish and bearish – are most extended from their rising (or falling) 200 day Simple Moving Average?
Let’s use this simple yet effective stock scan to highlight eight trade-trending (or fading) candidates right now:

This scan was created from FinViz.com’s Screener Tool focusing on the stocks most over and under extended from the 200 day SMA.
The scan charts the stocks farthest away from the average in percentage terms.
Right now, Monster (MNST) is the most extended and trending stock, followed by Edwards Life Sciences (EW), Yahoo (YHOO), and Southwest Airlines (LUV).
The general strategy here is to highlight these as strong relative strength candidates and put these on watch-lists for future buy signals, usually on retracements.
The more aggressive strategy is to play a “Mean Reversion” strategy which calls for fading overextended stocks as they (ideally) move back toward rising averages (a counter-trend, short-term play).
Personally, I prefer pro-trend strategies but you can use this list however best fits your trading goals.
Our downtrending extending stocks include the following:

Avon  Products (AVP), Denbury (DNR), Transocean (RIG), and Nabors Industrials (NBR).

Please share this article

The Case for Dividends

• Bond yields have been in a secular decline since the early 1980s. For example, the US 10-year Treasury yield peaked at roughly 16% in 1981 versus 2.3% today. With bond yields so low, investors have increasingly looked to equities to meet their income and cash flow needs. We believe there are a number of long-term supportive trends for dividend-paying stocks and therefore continue to view them as the cornerstone of any investor portfolio.
• History shows that dividends account for a significant portion of total stock returns. Since 1988, the S&P/TSX Composite Index (S&P/TSX) has returned a cumulative 370% on a price basis. However, on a total return basis (including reinvested dividends) the S&P/TSX has returned 823%. This equates to dividends accounting for roughly 50% of total returns over this period. (more)

Please share this article

This Week in Money with Guests: David Morgan, Eric Coffin, Tim Wood – Nov. 22, 2014


Please share this article

Avi Gilburt – What Is The Elliott Wave Theory Saying Now About Gold and Oil?

from Financial Survival Network
 Avi Gilburt went from playing professional hockey, to a career in a law and accounting, to becoming a master Elliott Wave interpreter. He tells us his story, sad in parts, inspiring in others. In the past three years, the cycle theorists have called these markets right far more often than anyone else. There’s a reason why and Avi explains it to us. He also tells us why he believes there’s big money to be made in the gold miners and the oil drillers, if you have the guts and the staying power. A new guest, you’ll be hearing from Avi a lot more in the future.
Click Here to Listen to the Audio
Please share this article

US Weekly Economic Calendar

time (et) report period ACTUAL CONSENSUS
forecast
previous
MONDAY, NOV. 24
8:30 am Chicago Fed national activity index Oct.   -- 0.25 3-month
TUESDAY,  NOV. 25
8:30 am GDP revision Q3   3.3% 3.5%
9 am Case-Shiller home prices Sept.   -- 5.1% y-o-y
9 am FHFA home prices Sept.   -- 4.8% y-o-y
10 am Consumer confidence index Nov.   96.7 94.5
WEDNESDAY, NOV. 26
8:30 am Weekly jobless claims Nov. 22   288,000 291,000
8:30 am Personal income Oct.   0.4% 0.2%
8:30 am Consumer spending Oct.   0.4% -0.2%
8:30 am Core PCE price index Oct.   0.2% 0.1%
8:30 am Durable goods orders Oct.   -0.8% -1.1%
9:45 am Chicago PMI Nov.   -- 66.2
9:55 am Consumer sentiment index Nov.   89.5 89.4
10 am New home sales Oct.   470,000 467,000
10 am Pending home sales Oct.   -- 0.3%
THURSDAY, NOV. 27
  Thanksgiving Day
None scheduled
       
FRIDAY, NOV. 28
  None scheduled  
   
Please share this article

Saturday, November 22, 2014

Chen Lin Says Gold Miners Need to Produce at $1,000/oz or Less to Survive

The Gold Report: You've discussed in your newsletter Goldman Sachs' plan to "push gold [down] to $1,000/ounce" ($1,000/oz). How do you know such a plan exists?
Chen Lin: I am not a big fan of conspiracy theories, but Goldman published a report in early September calling for $1,000/oz gold by the end of 2014. As I saw it, this call was quite aggressive. Goldman will lead and probably has been leading a group shorting gold aggressively. (more)

Please share this article