Friday, October 5, 2012

US Airways Group, Inc. (NYSE: LCC)

US Airways Group, Inc., through its subsidiaries, provides air transportation for passengers and cargo. It offers scheduled passenger service on approximately 3,100 flights daily to 200 communities in the United States, Canada, Mexico, Europe, the Middle East, the Caribbean, and Central and South America; and hourly shuttle service between Boston, LaGuardia, and Washington National. The company operates hubs in Charlotte, Philadelphia, and Phoenix; and a focus city in Washington, D.C. at Ronald Reagan Washington National Airport. As of December 31, 2011, it operated 340 mainline jets supported by its regional airline subsidiaries and affiliates operating as US Airways Express, which operated 233 regional jets and 50 turboprops. US Airways Group, Inc. was founded in 1981 and is headquartered in Tempe, Arizona.

To review US Airways's stock for potential trading opportunities, please take a look at the 1-year chart of LCC (US Airways Group, Inc.) below with my added notations:

1-year chart of LCC (US Airways Group, Inc.)


LCC caught my attention due to the one basic price level at $10 (navy). Not only is the $10 resistance clearly visible from February thru April, but $10 has also been a strong area of support since the beginning of May as well. So, the $10 price level is key to this stock. All tests of LCC's $10 support have gained at least a 10-20% run up

New! Gold Investor Index

goldnews.bullionvault.com / By Adrian Ash
 DOLLAR Gold Prices put on 7.7% in September, and hit new all-time highs against the Euro and Swiss Franc, writes Adrian Ash, head of research atBullionVault.
So who’s doing the buying, and driving prices higher? New data we released today here at BullionVault show that private households are continuing to join the bull market.
But the response by retail investors to both QE3 and the latest phase of the Eurozone crisis is more measured – some analysts might say complacent, even – than the recent price action alone might suggest.
BullionVault‘s new Gold Investor Index provides a unique  window onto private-investor sentiment towards physical gold. The prompt came from our contacts and colleagues in the wholesale professional market – dealers and traders who are always happy to share their views and opinion, but who have been asking us what we’re seeing on our own peer-to-peer exchange, used by 42,000 private investors from 159 countries.
So the Gold Investor Index is a monthly data point, based on actual trading on BullionVault, the world’s largest provider of physical gold ownership to private investors. Almost 90% of its users live in the UK, US or Eurozone. Our Gold Investor Index shows whether more of those people are buying or selling gold, or choosing to sit tight.
READ MORE

Gerald Celente – Alex Jones Radio. October 3, 2012


Thursday, October 4, 2012

Do Western Central Banks Have Any Gold Left???

by Eric Sprott & David Baker, Sprott Asset Management
Gold Seek

Somewhere deep in the bowels of the world’s Western central banks lie vaults holding gargantuan piles of physical gold bars… or at least that’s what they all claim. The gold bars are part of their respective foreign currency reserves, which include all the usual fiat currencies like the dollar, the pound, the yen and the euro.
Collectively, the governments/central banks of the United States, United Kingdom, Japan, Switzerland, Eurozone and the International Monetary Fund (IMF) are believed to hold an impressive 23,349 tonnes of gold in their respective reserves, representing more than $1.3 trillion at today’s gold price. Beyond the suggested tonnage, however, very little is actually known about the gold that makes up this massive stockpile. Western central banks disclose next to nothing about where it’s stored, in what form, or how much of the gold reserves are utilized for other purposes. We are assured that it’s all there, of course, but little effort has ever been made by the central banks to provide any details beyond the arbitrary references in their various financial reserve reports.
Continue Reading at GoldSeek.com…

Natural Gas — Now this is what a bottom looks like

Nat Gas completes major bottom — trend should now be up for several years

A major bottom is significant for two reasons, both equally important for trading.
  1. The low price is in place
  2. The market should trend higher for an extended period of time
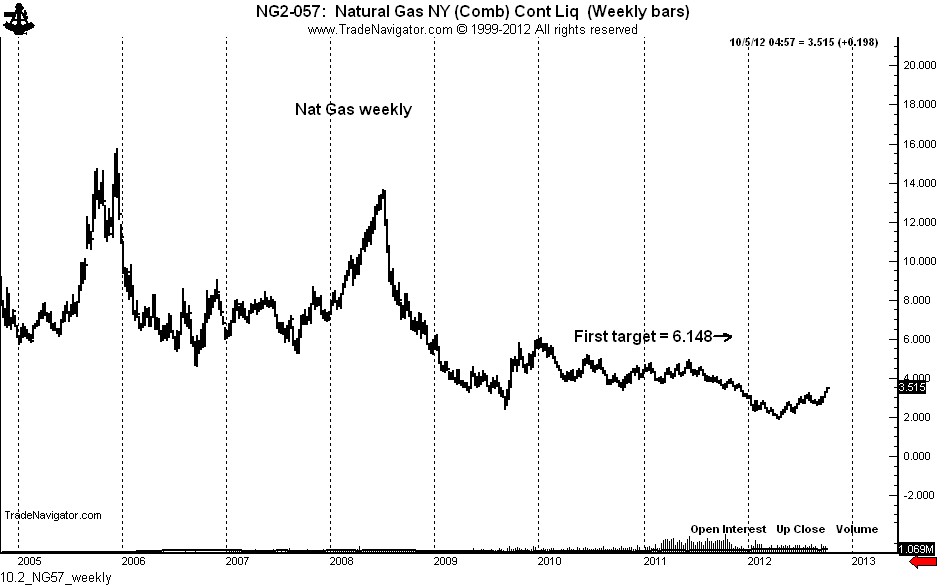
Thus is the case for Natural Gas. The weekly chart below shows that Nat Gas has been in a bear trend for 6-1/2 years. During this time the price of the nearby futures contract has declined from a high of 15.780 (Dec. 2005) to a low of 1.902 (Apr. 2012), a decline of 88%. I think this qualifies as a bear market.
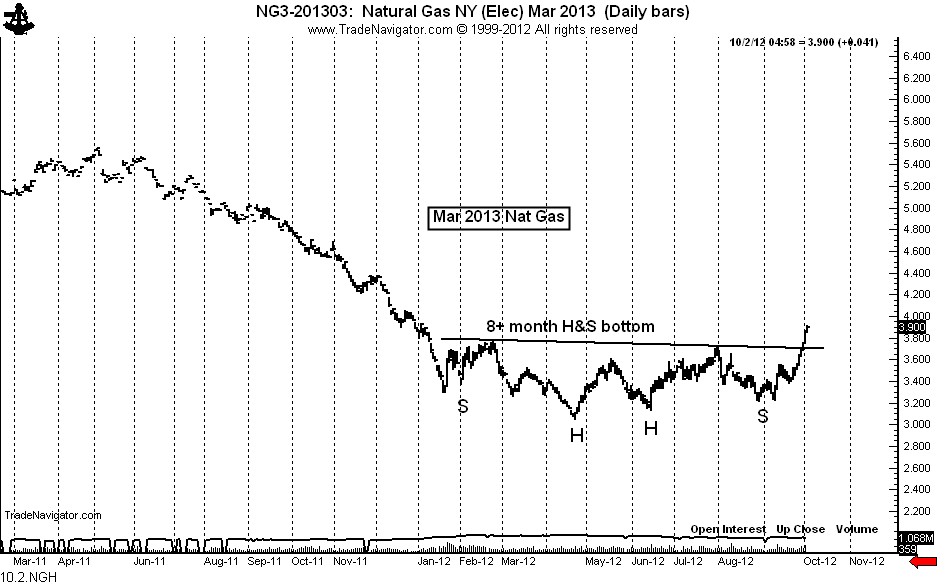
The daily chart now shows a decisive and massive complex H&S bottom in the March 2013 (and all other) contract(s).
A multi-year bullish trend has begun. The initial target is the 2010 high above 6.000. I must point out that trends are all subject to backing and filling. Nat Gas will be no different. The market has already had a good run. Traders should look for periods of weakness (10 to 15% dips) to be a buyer.
I AM NOT A FAN OF UNG (the ETF). It is possible that the price of futures could advance with the price of UNG actually declining.

Silver Manipulation Special Bulletins, with Special Guest Andrew McGuire

by Andrew Hoffman
Miles Franklin


On Friday afternoon, the CFTC’s “so-called” position limits proposal – so-called, as I don’t believe it was EVER anything more than PROPAGANDA – was “thrown out” of court by a lower level District of Columbia judge…
Judge throws out CFTC’s position limits rule
Here’s what I wrote about the “decision” this weekend…
The CRIMINALS – as I have continually predicted – were granted the ability to continue naked shorting PAPER PM, in a decision that “coincidentally” emerged late Friday afternoon, giving the Cartel “cover” to attempt another “SUNDAY NIGHT SENTIMENT” attack – just like last week’s similar, FAILED attempt to knock PMs down.
Continue Reading at MilesFranklin.com…

Eight Signs the System is Broken

by Simon Black
Sovereign Man

Here are a few interesting tidbits to chew on:
1) In the land of the free, there are now more than 760 incarcerated inmates for every 100,000 citizens. This is more than 5x the 1980 average, and it far surpasses the number (560 per 100,000) that Stalin threw in the Gulag at the peak of Soviet terror.
2) Apparently, Americans are getting more interested in snitching on each other. According to Google Trends, internet searches for terms such as “IRS reward” (and related keywords) have exploded since 2008, and especially this year.
Continue Reading at SovereignMan.com…