Thursday, January 26, 2012

Failed treasury auction portends Egyptian disaster

Investors bought less an a third of the 3.5 billion Egyptian pounds (US$580 million) worth of Treasury bills offered to the market on January 22, a red flag warning that Egypt's foreign exchange position is close to the brink.

Yields on Egyptian government debt maturing in nine months jumped to nearly 16%, but the government could not place its local-currency debt to Egyptian investors, even at that exorbitant rate.

This is a new and ominous decline in the financial position of the most populous Arab country. I have been warning since last May that "Egypt is running out of food, and, more gradually, running


out of the money with which to buy it." How fast this may occur is hard to specify, but the government's inability to borrow on money markets suggests that the crunch is not far off. (See The hunger to come in Egypt Asia Times Online, May 10, 2011.)


Interest rate on Egyptian 9-month treasury bills

Source: Bloomberg


Egypt faces a disaster of biblical proportions, and the world will do nothing about it. Officially, Egypt's foreign exchange reserves fell by half during 2011, including a $2.4 billion decline during December - from $36 billion to $18 billion, or about four months of imports. (more)

Another Chance to Sell Common Stocks and Buy Precious Metals


It has been a tough last year for precious metals investors but not so much for common stocks. Sure, the Euro crisis benefited Gold initially but as the panic has abated, stocks are rallying back to their highs while Gold has sold off and the gold stocks are trying to hold their lows. What is going on? Are we in the twilight zone?Bull and bear markets are long lasting, providing ample time for trends and counter trends to continually reappear and redevelop. The long-term activity of precious metals and common stocks is not a mystery. Gold has continued to hit all-time highs while the gold stocks eclipsed and maintain 2008 highs as support. Yes, common stocks are rallying but are nowhere close to seriously testing 2008 highs. Recently, we noted a potential major bottom in both the metals and the mining stocks. With common stocks nearing major resistance, it is no surprise that we are nearing a point where the secular bull trend is ripe for reemergence.

The chart below shows Gold against the S&P 500. Note the similarity between 2003-2006 action and 2009-2012 action. After surging higher, the ratio retreats quickly but then forms a bottom and builds a base. The ratio has found strong support and won’t be going lower anytime soon. Stocks have had a nice relief rally against Gold but it looks to be all but over.

Turning to Gold Stocks against Stocks, we find this ratio at a confluence of support. Yes, the mining equities had a difficult 2011 but it was nowhere close to their severe under-performance in 2008. Technically, the ratio looks likely to bottom soon and reverse course.

Moving along, we see the S&P 500 closing in on an area of strong resistance. Common stocks remain in a secular bear market and as a result, the market is nearing another sell signal. Conversely, the gold stocks which are in a secular bull market, are digging out a bottom

Investors and traders have to monitor charts and also sentiment which tells us more about fund flows and risk versus reward. Below is a screenshot of a new indicator developed by sentimentrader.com. They are combining put-call ratios, short interest and analyst ratings to develop another indicator for the various sectors. As you can see, every sector is either at or very close to a sell signal while the gold stocks are the only sector on a buy signal.

It may take a few months but common stocks are nearing an important peak. They won’t crash but they will act typical of what we see in the last third of a secular bear market. Doom and gloomers and extreme deflationists ignore the obvious reasons why stocks will begin a mild cyclical bear market and nothing of the sort of the previous two bear markets. At the same time, the precious metals sector is set to emerge from a major bottom and spend 2012 working its way towards the next major breakout that will serve as a catalyst for the beginnings of a bubble.

Good Luck!

Jordan Roy-Byrne, CMT
Jordan@TheDailyGold.com

Wednesday, January 25, 2012

You won't believe who owes U.S. billions

How would it be if the next few hundred billion dollars or so in U.S. bills could be paid off in cash? No borrowing. No additional debt.

Just as Barack Obama is planning to borrow another pile of currency, probably from China, to pay for his programs and promotions, calls are starting to develop for the U.S. to call in the debts that are due – and have been due for roughly two generations.

Those would be the sovereign debt bonds sold by China before the communist revolution – bonds that were issued with the promise by the Chinese that they would be an internationally recognized debt of China and its successor governments until paid.

But so far? Nothing.

The issue got the attention of Peter Huessy, the president of GeoStrategic Analysis, a defense forecasting firm, in a commentary at Fox News not long back.

“Many people assume China has the U.S. over a barrel. The country buys so much of our debt – around $800 billion – that we cannot ‘rock the boat’ when it comes to U.S. and China relations. That has meant not pressing the PRC ‘too hard’ when it comes to North Korea, or Iran,” he wrote. “Just recently, a top Obama administration delegation visited the People’s Republic of China. While there, the Chinese were told not to worry about the U.S. paying its debts to the country – their investments in the U.S. were safe. True enough.”

But he added, “I was struck with the fact that the PRC, however, does not pay its debts to the U.S.”

WND reported when Obama’s first “stimulus” package of some $700 billion-plus was being pushed through Congress that some of the beneficiaries would be Chinese companies – even while the billions of unpaid debt remained outstanding.

At that time, Kevin O”Brien, writing for the Global Association of Risk Professionals, warned that the situation could develop into a significant problem.

“One of the greatest problems facing China is the government’s failure to acknowledge and effectively address the true extent of state institutions’ bad debt,” he wrote.

“The repayment obligation was inherited by the People’s Republic of China, when the communists took control in 1949. The successor government doctrine of settled international law affirms continuity of obligations among international recognized successive governments,” O’Brien wrote.

Huessy explained what happened.

“Many decades ago, China sold sovereign bonds worldwide to investors in many nations. They sold tens of thousands of these bonds on U.S. soil to American citizens on the recommendation of our government, indicating it was a solid investment,” he said. “Over the last sixty years, China has refused to pay to these bondholders either the principal or interest on these full faith and credit sovereign bonds.”

He noted that in 1987 the British financial markets threatened to keep China out because of the unpaid bonds due to owners in that nation, so the Chinese reached agreement to pay up. But only to those bondholders.

That’s what is know as a “selective default,” meaning some debts were paid but others were not, Huessy said.

He noted that U.S. credit rating agencies such as Standard and Poor’s claim they simply can overlook that.

“Under the rules, they are granted a license by the Security and Exchange Commission (SEC) of the United States to be a nationally recognized statistical rating organization (NRSRO), a charter to assess the risk of investing in sovereign and corporate debt, stocks, or bonds. The ‘selective default’ of the PRC must be acknowledged, in that the metrics used by the NRSRO organizations that they themselves have promised to follow as part of their license agreement includes just such a requirement,” he warned.

“Now if China was found in selective default, this would cause the PRC to have to pay considerably more to finance its debt than it does now. Billions more,” he said.

He noted that China insisted, when Saddam Hussein’s government in Iraq collapsed several years ago, that any successor government in Iraq must be held to the existing debts, and the U.N. agreed to its demands.

“Currently, the People’s Republic of China owes a debt of over $750 billion to American citizens who are holding these full faith and credit sovereign bonds (many of them denominated in gold) sold to them by the Republic of China. Worldwide, the debt China owes to all bondholders is estimated to be several trillion dollars. The debt owed to the American people should be paid. The U.S. government could dollar for dollar offset bond interest we owe China with interest, principal and penalties China owes us,” Huessy said.

It wasn’t too far off the date when China demanded Iraq be held to account that the Chinese Ministry of Finance in 2006 issued an official communiqué addressed to “the Embassy of the United States of America in China,” in which the Chinese government formally repudiated China’s defaulted full faith and credit sovereign debt and announced that it would not repay any debt held by America, O’Brien explained.

China, meanwhile, continues to boast of its economic growth and influence, moves that periodically prompt outraged members of Congress to try to bring the issue to a head. A few years back it was Sen. James Inhofe, R-Okla., tried to advance a resolution noting China’s attempt “to conceal its defaulted government debt from investors.”

Huessy indicated that the White House should be jumping on the issue.

“That could even be part of the upcoming budget and debt agreement, paid down over a period of years,” he noted.

Meanwhile, under last year’s debt increase law, Obama can raise the nation’s debt cap, now $15.2 trillion, after he notifies Congress of the need unless his plan is opposed by a two-third supermajority, an unlikely event.

Fox News reports that almost $1 trillion of the new debt for the U.S. “can be attributed to Obama’s 2009 deficit-financed economic stimulus package,” of which some of the benefits went to Chinese-owned companies.

http://www.wnd.com/2012/01/find-out-who-owes-u-s-billions/

Jay Taylor: Turning Hard Times Into Good Times


1/24/2012: Gold & Country Confiscation. What Can You Do About It?

James Paulsen: Investment Outlook (January 23, 2012)

Main Street Misery Sets Wall Street’s Valuation

Investment and Economic Outlook, January 23, 2012

by James Paulsen, Chief Investment Strategist, Wells Capital Management (Wells Fargo)
During 2011, the stock market suffered a significant erosion in its price-earnings (PE) multiple. On a trailing four-quarter basis, the PE multiple on the S&P 500 finished 2011 at about 13 times compared to about 15 times at the end of 2010. Rising earnings were offset by a declining valuation resulting in a flat stock market last year. Will the stock market’s valuation revive in 2012? And, what is the outlook for PE multiples during the next several years?

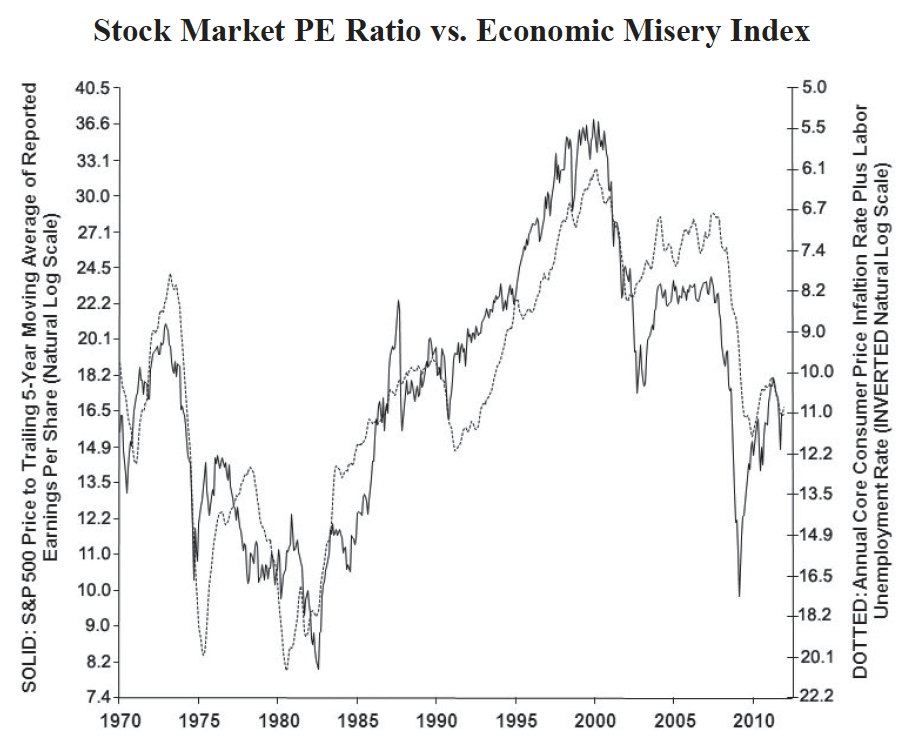
The valuation of Wall Street often reflects the character of Main Street. Indeed, for the last several decades the PE multiple of the stock market has been closely related to the Misery Index (sum of the U.S. unemployment rate and the core consumer price inflation rate) on Main Street. A higher (declining) unemployment rate and/or inflation rate tends to lower (raise) the valuation investors are willing to pay for stocks. In the aftermath of the 2008 crisis, “Main Street Misery” remains high suggesting that Wall Street valuations could rise substantially in future years should Main Street fortunes slowly improve.

PEs and MISERY

The accompanying chart overlays the S&P 500 PE multiple with the Misery Index. The PE multiple is based on the trailing five-year moving average of reported earnings and the Misery Index is shown on an inverted scale (misery rises when the dotted line declines). Since 1970, the sum of the unemployment rate and the core consumer inflation rate has done a good job duplicating the movements of the stock market PE multiple. That is, the valuation of the stock market is consistently impacted by the rate of inflation and labor unemployment on Main Street.

The collapse of the PE multiple in the 1970s resulted from both runaway inflation and stubbornly high rates of labor unemployment. Conversely, the Great Bull Run of the 1980s and 1990s occurred against the backdrop of a steady decline in both the inflation rate and unemployment rate. From 1980 until 2000, the core consumer price inflation rate declined from about 13 percent to 2 percent. The unemployment rate fell from a post-war high of 10.8 percent in 1982 to a low near 4 percent in the 1990s. Lower inflation and declining unemployment combined to improve the Misery Index from about 20 percent to only about 5.5 percent which produced about a four-fold increase in the S&P 500 PE multiple! Since 2000, however, although the core inflation rate has trended sideways, the unemployment rate has surged causing a near doubling in the Misery Index, and a halving in the S&P 500 PE multiple. It appears “Misery on Main Street” establishes “Valuation on Wall Street.” Therefore, what is the outlook for “Main Street Misery” and what does it imply about future stock market PE multiples?

A Little “Misery Math” for Stock Investors?

Currently, the Misery Index is 10.7 comprised by an 8.5 percent unemployment rate and a 2.2 percent core inflation rate. The stock market’s trailing 5-year PE multiple is about 16.5 times. What does a little “Misery Math” imply for the stock market in 2012?

The pace of job creation finally appears to be strong enough to produce a slow but steady decline in the unemployment rate. A modest assumption for 2012 would be the unemployment rate declines to between 7.5 percent and 8 percent. The core consumer price inflation rate is also likely to moderate this year. A significant decline in commodity prices last year, a recent moderation in core producer price trends (sixmonth annualized core PPI inflation slowed to 2.3 percent in the second half of 2011 versus a 3.7 rise in last year’s first half) and a continued deceleration in wage inflation suggest a mild decline this year (perhaps to between 1.5 and 2 percent?) in core consumer price inflation. Assuming the unemployment rate declines to 7.7 percent and the core consumer price inflation rate drops to 1.8 percent, the Misery Index would fall to 9.5 percent in 2012. The accompanying chart implies about a 19 to 20 PE multiple with a 9.5 percent Misery Index. Finally, assuming 2012 S&P 500 earnings per share reach current consensus expectations of $105, the trailing five-year average earnings would be about $80. A 19 PE multiple applied to $80 yields a S&P 500 target price for 2012 of 1520.

What does the Misery Index suggest for the stock market longer term? Looking out a few years is, of course, much more uncertain. However, if the recovery continues for the next four years, the unemployment rate would likely slowly decline to between 4 and 6 percent. The real wild card for the Misery Index and therefore the stock market longer term is what happens to core consumer price inflation. Assume the unemployment rate declines to 5 percent, but consider three different inflation scenarios—a high inflation outcome of 10 percent core inflation, a medium inflation outcome of 5 percent, and a low inflation outcome of 2 percent. It seems reasonable that as the recovery matures, core consumer inflation will not likely be much lower than it is today and could be substantially higher.

Finally, we conservatively estimate that four years from now, five-year trailing S&P 500 share earnings would reach $120, $115, and $110 respectively in the high, medium, and low inflation scenarios. What are the implied four-year forward S&P 500 price targets for each of these scenarios? The high inflation scenario implies a 15 percent Misery Index and from the accompanying chart this yields a PE multiple of about 11.5 and a future price target of 1380. The medium inflation scenario yields a PE multiple of 18.2 and a price target of 2093. Finally, the low inflation scenario implies a 27 PE and a price target of almost 3000!

Summary

As the accompanying chart illustrates, Main Street and Wall Street are closely connected. Misery on Main destroys the Valuation on Wall!

For 2012, the stock market could be driven higher by improved optimism and renewed confidence resulting from a slow but steady decline in the unemployment rate. Indeed, the relationship between the Misery Index and the PE multiple suggests a 1500 price target for the S&P 500 is reasonable assuming only modest declines this year in the unemployment rate and core inflation.

Long term, however, what will prove most important for Wall Street is the inflation outcome. If the character of the contemporary recovery is ravished by surging inflation, the stock market may reflect ongoing Main Street Misery by extending its decade long sideways trading channel. Alternatively, should inflation remain reasonably contained during the next few years of this recovery, stock market valuations may surge higher as the Misery Index on Main Street steadily improves.

BP Energy Outlook To 2030: BP, DVN, PBR, XOM

BP (NYSE:BP) expects global demand for energy to continue to grow over the next two decades, driven by population and income growth from the emerging economies. These forecasts and others related to supply and demand for energy are contained in Energy Outlook 2030, a long-term macro outlook on energy trends recently published by BP.

Global Energy Growth
BP estimates that demand for all forms of energy will increase by 39% through 2030, equal to a 1.6% annual rate. The company expects virtually all of this growth to come from non-OECD countries.

This rate of growth is slightly less than growth forecast by Exxon Mobil (NYSE:XOM) in The Outlook for Energy, a similar publication released by that company in December 2011. The company is looking for annual growth in energy demand to average 0.9% from 2010 to 2040.

Assumptions Used
BP's energy demand growth estimates are based on population growth of 0.9% per year through 2030, implying an additional 1.4 billion people. The company also assumes growth in GDP of 3.7% per year over the next two decades, an increase over the actual growth of 3.2% from 1990 to 2010.

Sources of Growth
As one might expect, BP is looking for almost all demand growth for energy to come from non-OECD countries. The company expects energy consumption for these nations to be 69% higher in 2030, with growth averaging 2.7% per year.

Market Share
BP also expects fossil fuels to maintain its status as the chief source of energy through 2030, with 81% of demand comprised of oil, natural gas and coal by the end of the forecast period. In 1990, these three fossil fuels supplied 89% of the world's energy needs.

The relative share of energy demand within the fossil fuel category will also shift markedly, according to BP, with crude oil losing the most market share through 2030. The company expects demand for liquids to grow 18%, and reach 103 million barrels per day by 2030. This growth, while impressive, will reduce its share of energy demand to 27% by 2030, down from 39% in 1990.

Natural gas demand will gain market share through 2030, with this commodity's market share reaching 26% by 2030, up from 22% in 1990.

Energy Independence?
One interesting prediction by BP is that the Western Hemisphere will become almost totally energy self-sufficient by 2030. This independence will be powered by increased production from the oil sands of Canada, deepwater areas offshore Brazil and production from shale oil and natural gas in the onshore United States, coupled with the anticipated overall decline in oil demand.

Devon Energy (NYSE:DVN) has operations in two of these three areas and might benefit if BP's forecast is realized. The company is involved with the Jackfish Project, a multistage oil sands project in Canada, and also has extensive acreage in a number of onshore shale oil and natural gas plays in the United States.

Petroleo Brasileiro (NYSE:PBR) is the state oil company of Brazil, and has an intensive exploration and development program planned over the next five years. The company is expected to spend $224 billion from 2010 to 2014.

The Bottom Line
BP expects brisk growth in demand for energy to continue for the next two decades, with this growth coming from what used to be called the Second and Third World areas. While some investors might find this forecast reassuring, is anyone really surprised that yet another major oil company has provided a macro forecast that supports an investment in the sector.


The American Debt Imperium and the Mother of all Bubbles